Pending Home Sales props up markets [Video]
![Pending Home Sales props up markets [Video]](https://editorial.fxstreet.com/images/TechnicalAnalysis/SupportResistance/home-loans-market-gm499469109-42654844_XtraLarge.jpg)
US Dollar: Mar '23 USD is Down at 101.490.
Energies: Feb '23 Crude is Down at 79.64.
Financials: The Mar '23 30 Year T-Bond is Down 13 ticks and trading at 129.24.
Indices: The Mar '23 S&P 500 emini ES contract is 133 ticks Lower and trading at 4051.00.
Gold: The Feb'23 Gold contract is trading Down at 1944.40. Gold is 12 ticks Lower than its close.
Initial conclusion
This is not a correlated market. The dollar is Down, and Crude is Down which is not normal, and the 30 Year T-Bond is trading Lower. The Financials should always correlate with the US dollar such that if the dollar is lower, then the bonds should follow and vice-versa. The S&P is Lower, and Crude is trading Lower which is not correlated. Gold is trading Lower which is not correlated with the US dollar trading Down. I tend to believe that Gold has an inverse relationship with the US Dollar as when the US Dollar is down, Gold tends to rise in value and vice-versa. Think of it as a seesaw, when one is up the other should be down. I point this out to you to make you aware that when we don't have a correlated market, it means something is wrong. As traders you need to be aware of this and proceed with your eyes wide open. Currently Asia is trading Mixed with half the exchanges trading Lower and the other half Higher. All of Europe is trading Lower at the present time.
Possible challenges to traders today
-
Loan Officer Survey - tentative. Major.
-
Lack of Major Economic News
Treasuries
Traders, please note that we've changed the Bond instrument from the 30 year (ZB) to the 10 year (ZN). They work exactly the same.
We've elected to switch gears a bit and show correlation between the 10-year bond (ZN) and the S&P futures contract. The S&P contract is the Standard and Poor's, and the purpose is to show reverse correlation between the two instruments. Remember it's likened to a seesaw, when up goes up the other should go down and vice versa.
On Friday the ZN hit a Low at around 10:30 AM EST. The S&P was trading Higher at around the same time. If you look at the charts below ZN gave a signal at around 10:30 AM and the S&P gave a signal at around the same time. Look at the charts below and you'll see a pattern for both assets. ZN hit a Low at around 10:30 AM and migrated Lower. These charts represent the newest version of MultiCharts and I've changed the timeframe to a 15-minute chart to display better. This represented a Long opportunity on the 10-year note, as a trader you could have netted about 20 ticks per contract on this trade. Each tick is worth $15.625. Please note: the front month for the ZN is now Mar '23. The S&P contract is now Mar' 23 as well. I've changed the format to filled Candlesticks (not hollow) such that it may be more apparent and visible.
Charts courtesy of MultiCharts built on an AMP platform
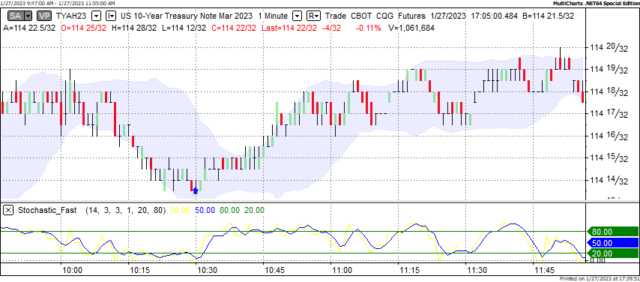
ZN - Mar 2023 - 1/27/23
-638106755219153774.png)
S&P - Mar 2023 - 1/27/23
Bias
On Friday we gave the markets a Neutral or Mixed bias as we didn't see much in the way of correlation Friday morning. The Dow traded Higher by 29 points and the other indices closed Higher as well. Today we aren't dealing with a correlated market and our bias is Neutral.
Could this change? Of Course. Remember anything can happen in a volatile market.
Commentary
On Friday the markets veered to the Upside based on economic news and not geopolitical events. In our mind this is refreshing as the geopolitical landscape changes like clockwork. Pending Home Sales came in greater than expected coming in with a gain of 2.5% as opposed to a loss of 2.6% as shown in the previous period. Today we have virtually no economic news to speak of, so the markets will be left to its own devices. Will this be enough to propel the markets Higher? As in all things, only time will tell.
Author

Nick Mastrandrea
Market Tea Leaves


