Party like It’s 1999

Run, Bull, Run, was the cover story of Barron’s magazine in January 2000. The story presented arguments for “another record-breaking year for stocks”. Today, we know that it didn’t happen. Instead, the bull was a bubble and burst a few months later.
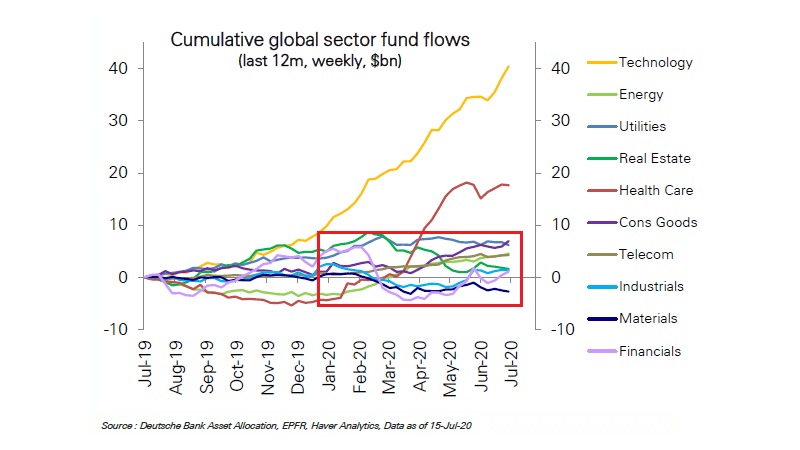
Source: Deutsche Bank, EPFR, Haver Analytics
Tech(no)
There are striking similarities between investors’ behavior around the millennium change and today. Speculative positioning on the back of extremely optimistic expectations channeled liquidity into the equity market. Investors piled into the tech sector as the first chart above reveals. Meanwhile, eight out of ten key industries flatlined during the same period in terms of fund flows. Digging deeper into the tech sector reveals that not even 50% of its components trade above their 200DMA. The buying is concentrated on very few stocks. A sign that investors are overconfident and pick their darlings among a few stocks from the FAANG+ group.
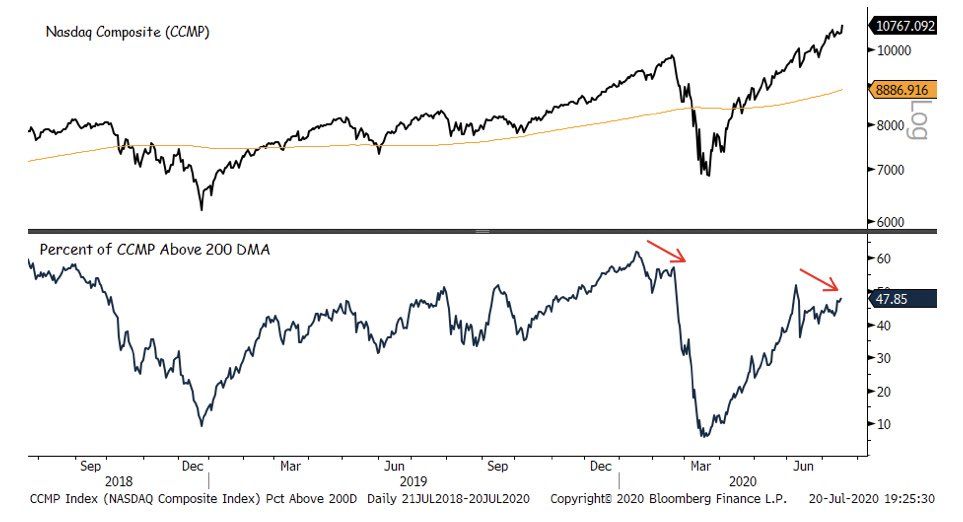
Source: Carl Quintanilla & Bloomberg Finance L.P.
Overconfidence
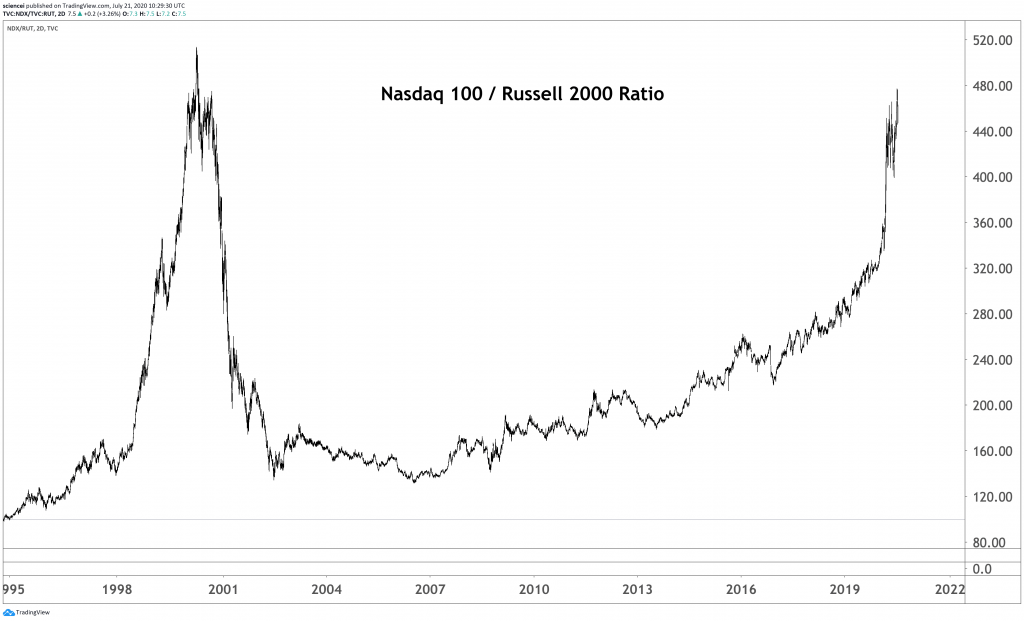
The development led to an overthrow in the Nasdaq 100 index. The pale grey trend had roughly a 19% p.a. total return appreciation over the past decade. That’s already more than double the long-term return history for stocks, which amounted to about 9%. An acceleration of that 19% trend from here on is most likely unsustainable. Moreover, the price premium relative to the 200DMA is the largest since 2000. The Nasdaq 100 has not been as overbought in twenty years according to this metric. Nonetheless, many investors are probably neither aware of technicals nor about the underlying valuations. The chart below shows a Nasdaq 100 to Russel 2000 ratio. It puts tech in relative terms to small caps and shows what happened during the past months. A 50% outperformance accumulated within a short time frame. The last time something similar occurred was during the dotcom bubble in 1998-2000. Once again, investors are partying like it’s 1999. Valuations don’t matter, trends get extrapolated, and the Fed put is part of almost all bullish narratives.
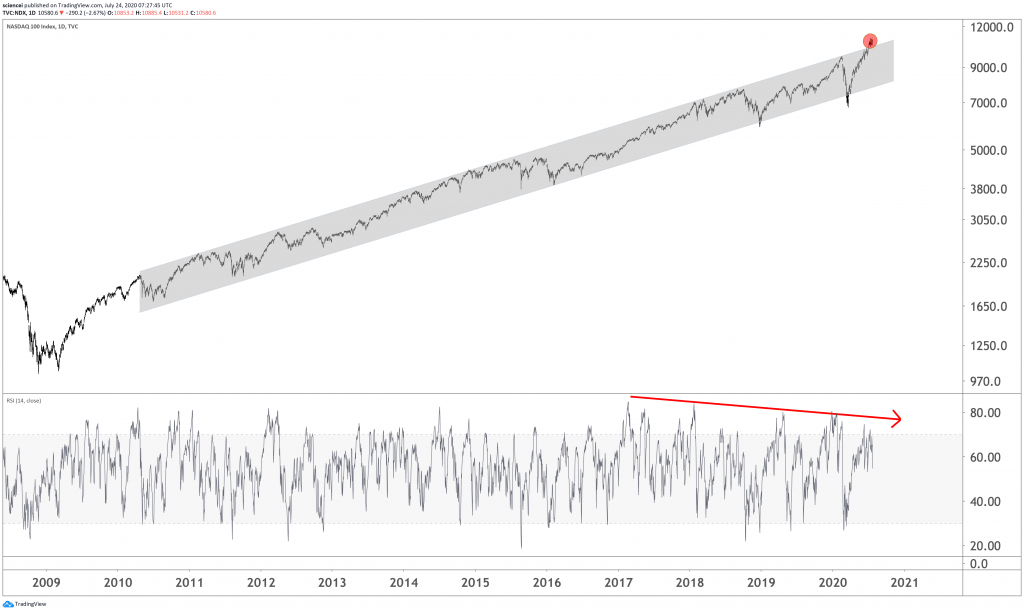
Source: ESI Analytics
No Technical Knockout (Yet)
The short-term technical picture favors the current situation to persist for a few more weeks as U.S. indices did not break below critical support levels. However, broad-based equity gains are unlikely during the next weeks. The rally is too stretched already despite being likely to hold up here. That changes with a sustained break below 10,300 in the Nasdaq 100, which takes the tech index back inside the pale grey long-term trend. Such action signals a confirmed overthrow failure and has been bearish historically. The S&P 500 has a similarly significant level running around 3,030. A break below that level signals that the sequence of higher highs and higher lows ended for the blue-chips index.
Source: ESI Analytics
Conclusion
The bottom line is that a bumpy road is the base case during the next few weeks. The major U.S. equity indices are likely to persist at elevated levels as long as the 10,300 and 3,030 levels hold in the Nasdaq 100 and S&P 500, respectively. However, the overheated technical and exuberant sentiment picture probably lead to a cycle high sooner rather than later. There is something different today than in 1999. A record-breaking percentage of economies are in recession worldwide. Recessionary pressure has been the natural predator of bull runs historically. Therefore, long-term investors are best off on the sidelines.
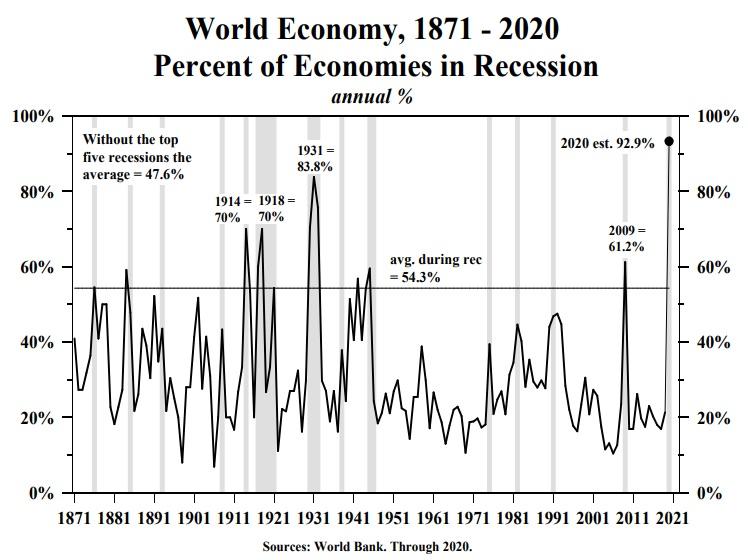
Source: World Bank & Christof Leisinger
Interested in more of our ideas? Check out Scienceinvesting for more details!
Author

Science Investing Team
Science Investing


