|

Palladium Shows Exhaustion Signals

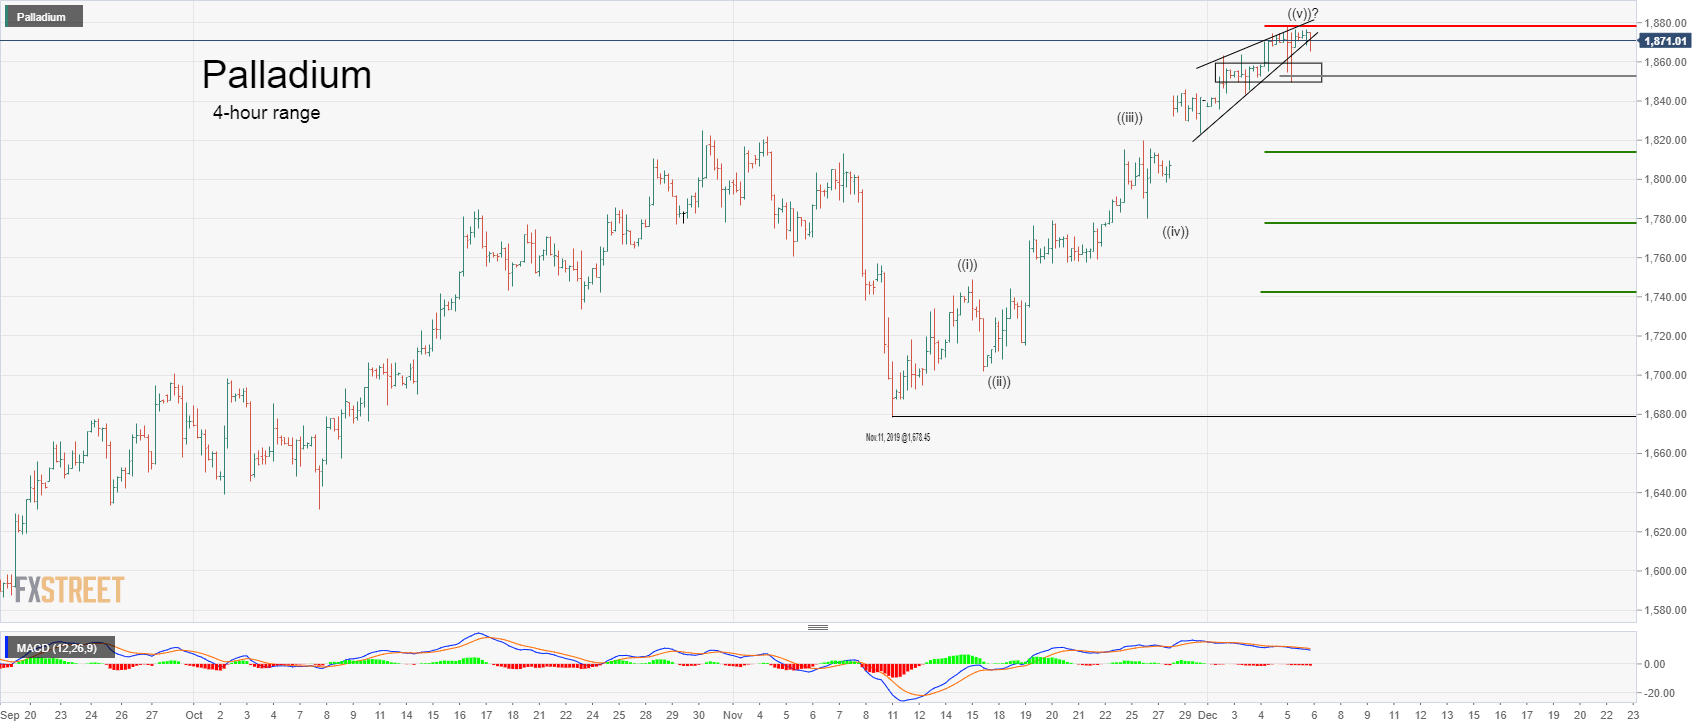
The price of Palladium in its 4-hour chart could be completing the upward impulsive movement that began on November 11 when it found buyers at $1,678.45 per ounce. Our arguments for expecting a selling position are as follows.

1. The precious metal may be completing a wave ((v)) labeled in black, which is forming an ending diagonal pattern. This structure of completion indicates the likelihood of a potential corrective movement. On the other hand, the US dollar index (DXY) is showing signs of upward reversal, which could drag to the Palladium's price to visit fresh lows.

2. A sell-side position will be active once the price falls and closes below $1,853 per ounce. Our conservative scenario has a bearish target at $1,813.27 per ounce.

3. If the price extends its drops, the Palladium could see new lows at $1,777.75 and $1,742.24 per ounce.

4. The scenario will be invalid if the price exceeds $1,878.31, or if the price penetrates but fails to close below $1,853 per ounce.

5. The risk of our bearish scenario could be a euphoric traders' sentiment that could be interested in boosting the price of the precious metal until the psychological $2,000 level.

Palladium

Trading Plan Summary

  • Entry Level: $1,853.

  • Protective Stop: $1,878.31.

  • 1st Profit Target: $1,813.27.

  • 2nd Profit Target: $1,777.75.

  • 3rd Profit Target: $1,742.24.


Try Secure Leveraged Trading with EagleFX!

Author

EagleFX Team

EagleFX Team is an international group of market analysts with skills in fundamental and technical analysis, applying several methods to assess the state and likelihood of price movements on Forex, Commodities, Indices, Metals and

More from EagleFX Team
Share:

Editor's Picks

EUR/USD consolidates around 1.0900, bullish bias remains ahead of key US data

The EUR/USD pair is seen consolidating its strong gains registered over the past two days and oscillating in a narrow band during the Asian session on Tuesday. Spot prices currently trade around the 1.1900 mark, just below an over one-week high touched the previous day.

GBP/USD tilts bullish as markets barrel toward mid-week NFP print

GBP/USD is holding a broader bullish structure on the daily chart, with price trading well above the 50 Exponential Moving Average at 1.3507 and the 200 EMA at 1.3310, confirming the intermediate uptrend that has been in place since the November 2025 low near 1.2300. 

Gold retreats below $5,050 on profit-taking ahead of US data

Gold price attracts some sellers in the Asian session on Tuesday, falling back below $5.050. The precious metal edges lower amid improved risk sentiment and some profit-taking. Traders look to the US Retail Sales data and Fedspeak due later in the day ahead of Wednesday's Nonfarm Payrolls release.  

Litecoin eyes $50 as heavy losses weigh on investors

Following a strong downtrend across the crypto market over the past week, Litecoin holders are under immense pressure. The Bitcoin fork has trimmed about $1.81 billion from its market capitalization since the beginning of the year, sending it below the top 20 cryptos by market cap.

The market is buying everything again but is it dancing on a borrowed floor

The market has a short memory and a fast trigger finger. Last week’s liquidation barely cooled before risk came roaring back, pushing the S&P toward record territory and reinstalling Big Tech as the engine of choice. This is not discovery. It is re exposure.

Ripple exposed to volatility amid low retail interest, modest fund inflows

Ripple (XRP) is extending its intraday decline to around $1.40 at the time of writing on Monday amid growing pressure from the retail market and risk-off sentiment that continues to keep investors on the sidelines.