|

Oil’s rally likely to stall, signaling deeper losses [Video]

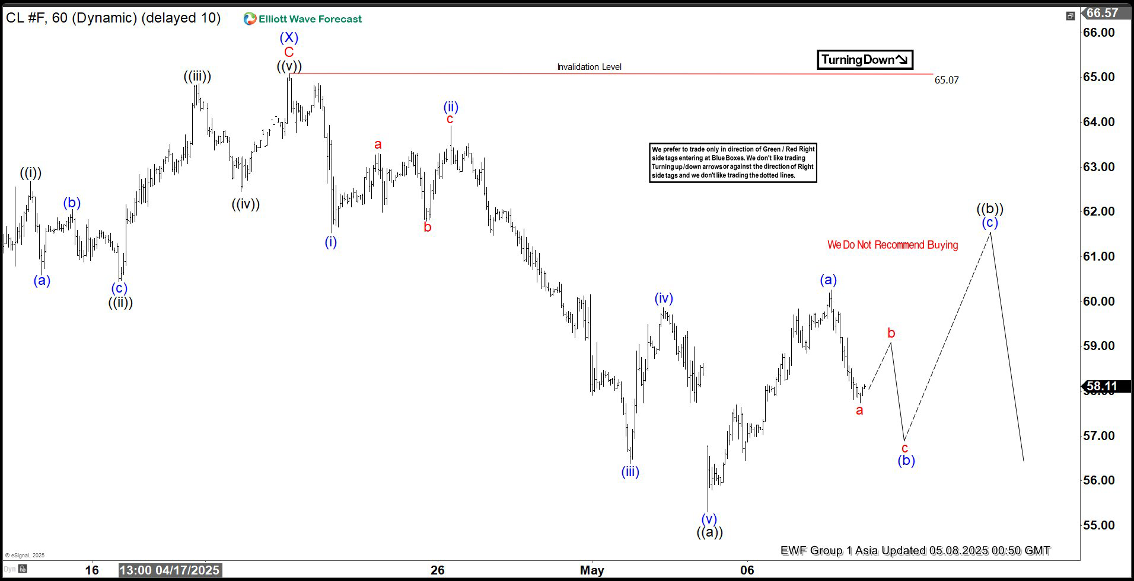
The current market cycle for Light Crude Oil (CL), starting from its high on January 15, 2025, is unfolding as a double three Elliott Wave pattern. This technical structure suggests a corrective phase with alternating declines and recoveries. From the peak, the price dropped to 55.12, completing wave (W), followed by a rally to 65.07, marking the end of wave (X). The decline has since resumed in wave (Y), which is breaking down into a WXY pattern, indicating further downside momentum.

Within wave (Y), the initial decline, wave W, is forming as a zigzag. From the wave (X) high, the price fell to 61.53 (wave (i)), then rallied to 63.92 (wave (ii)). The decline continued in wave (iii) to 56.39, followed by a bounce to 59.87 in wave (iv). The final drop in wave (v) reached 55.30, completing wave ((a)) in a higher degree. Currently, wave ((b)) is unfolding as a zigzag, with its first leg, wave (a), reaching 60.26. A pullback in wave (b) is expected soon, followed by a rise in wave (c) to complete wave ((b)).

Looking ahead, as long as the key resistance at 65.07 holds, any rally is likely to fail after 3, 7, or 11 swings, leading to further declines. Traders should watch these levels closely for potential selling opportunities.

Oil 60 minute Elliott Wave chart

Oil Elliott Wave [Video]

Author

Elliott Wave Forecast Team

Elliott Wave Forecast Team

ElliottWave-Forecast.com

More from Elliott Wave Forecast Team
Share:

Markets move fast. We move first.

Orange Juice Newsletter brings you expert driven insights - not headlines. Every day on your inbox.

By subscribing you agree to our Terms and conditions.

Editor's Picks

EUR/USD bounces toward 1.1750 as US Dollar loses strength

EUR/USD returned to the 1.1750 price zone in the American session on Friday, despite falling Wall Street, which indicates risk aversion. Trading conditions remain thin following the New Year holiday and ahead of the weekend, with the focus shifting to US employment and European data scheduled for next week.

GBP/USD nears 1.3500, holds within familiar levels

After testing 1.3400 on the last day of 2025, GBP/USD managed to stage a rebound. Nevertheless, the pair finds it difficult to gather momentum and trades with modest intraday gains at around 1.3490 as market participants remain in holiday mood.

Gold trims intraday gains, approaches $4,300

Gold retreated sharply from the $4,400  area and trades flat for the day in the $4,320 price zone. Choppy trading conditions exacerbated the intraday decline, although XAU/USD bearish case is out of the picture, considering growing expectations for a dovish Fed and persistent geopolitical tensions.

Cardano gains early New Year momentum, bulls target falling wedge breakout

Cardano kicks off the New Year on a positive note and is extending gains, trading above $0.36 at the time of writing on Friday. Improving on-chain and derivatives data point to growing bullish interest, while the technical outlook keeps an upside breakout in focus.

Economic outlook 2026-2027 in advanced countries: Solidity test

After a year marked by global economic resilience and ending on a note of optimism, 2026 looks promising and could be a year of solid economic performance. In our baseline scenario, we expect most of the supportive factors at work in 2025 to continue to play a role in 2026.

Crypto market outlook for 2026

Year 2025 was volatile, as crypto often is.  Among positive catalysts were favourable regulatory changes in the U.S., rise of Digital Asset Treasuries (DAT), adoption of AI and tokenization of Real-World-Assets (RWA).