Oil rebounds from major support; further upside?

West Texas Intermediate (WTI) oil has, so far, remained on the front foot on Tuesday, following Monday’s recovery from 15-month lows. Fears surrounding the banking sector witnessed the price of oil spiral south over the course of last week, shedding more than 13.0%, its largest one-week decline in months.
For those who read my Weekly Market Insight, you may recall that I highlighted potential support on both the monthly and daily timeframes, indicating a rebound could emerge this week.
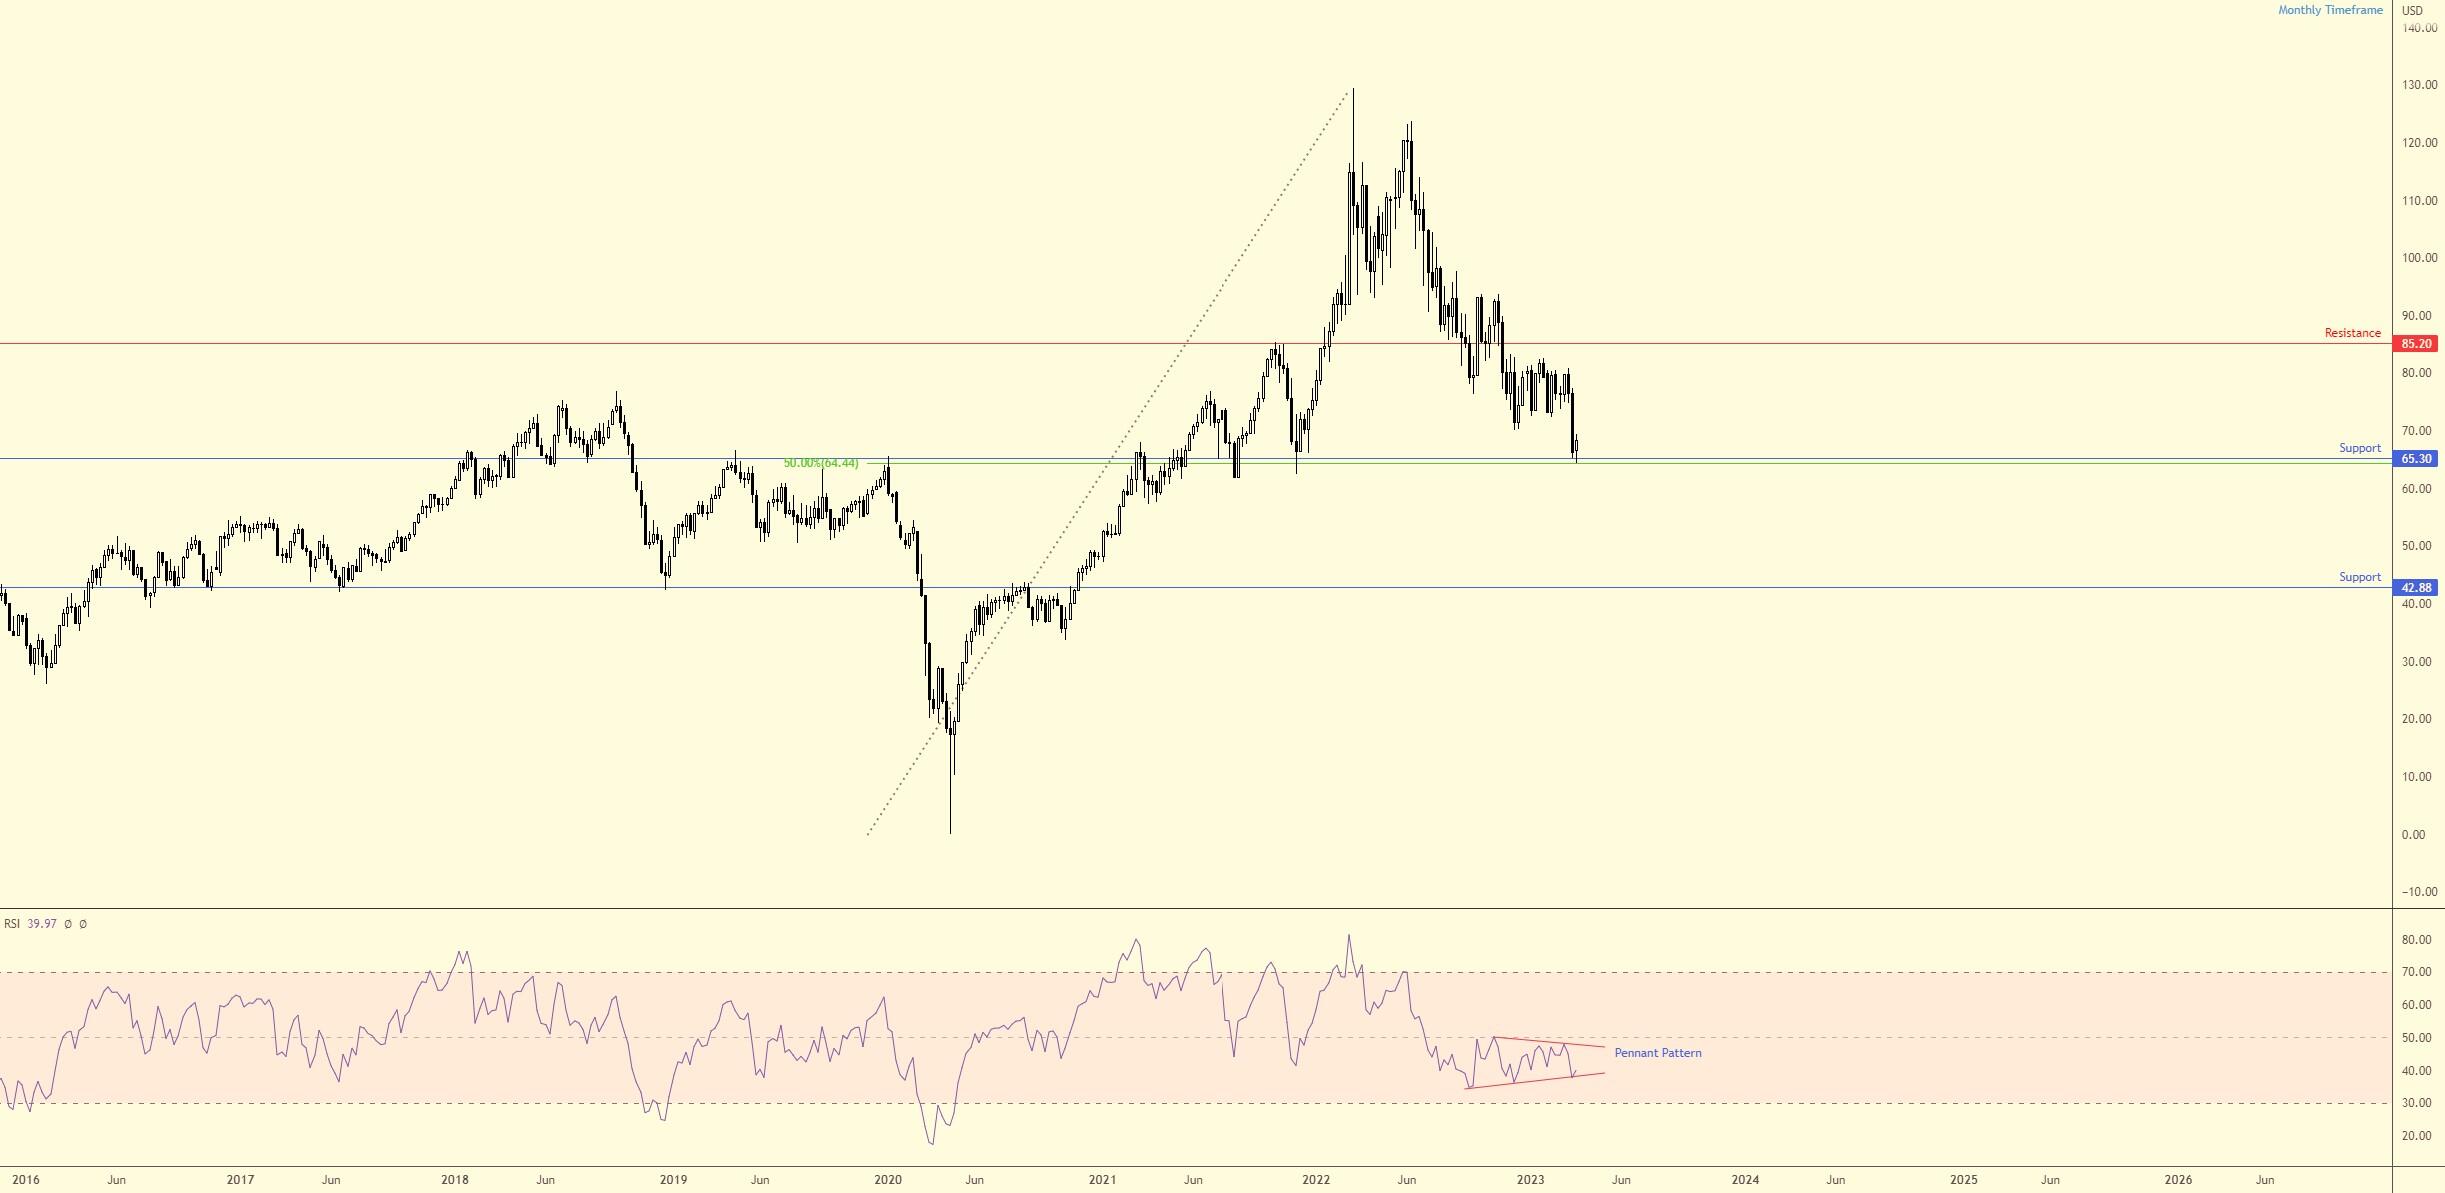
Monthly Chart: Clear Support
As can be seen from the monthly chart, support from $65.30 and the 50.0% retracement ratio at $64.44 welcomed buyers in recent trading. The interesting thing on the monthly scale is that the Relative Strength Index (RSI) has also been working with a consolidation between 34.78 and 50.17, forming what is referred to in technical circles as a ‘Bearish Pennant Pattern’. As the RSI shows, the indicator is currently rebounding from the lower boundary of the RSI pattern and, unlike price action recently refreshing lows, we have not seen the indicator follow suit, hence a lack of confirmation and potential divergence.
A failed RSI Pennant, therefore, could unfold here, and a subsequent breakout to the upside may be seen, which would underpin current price support.
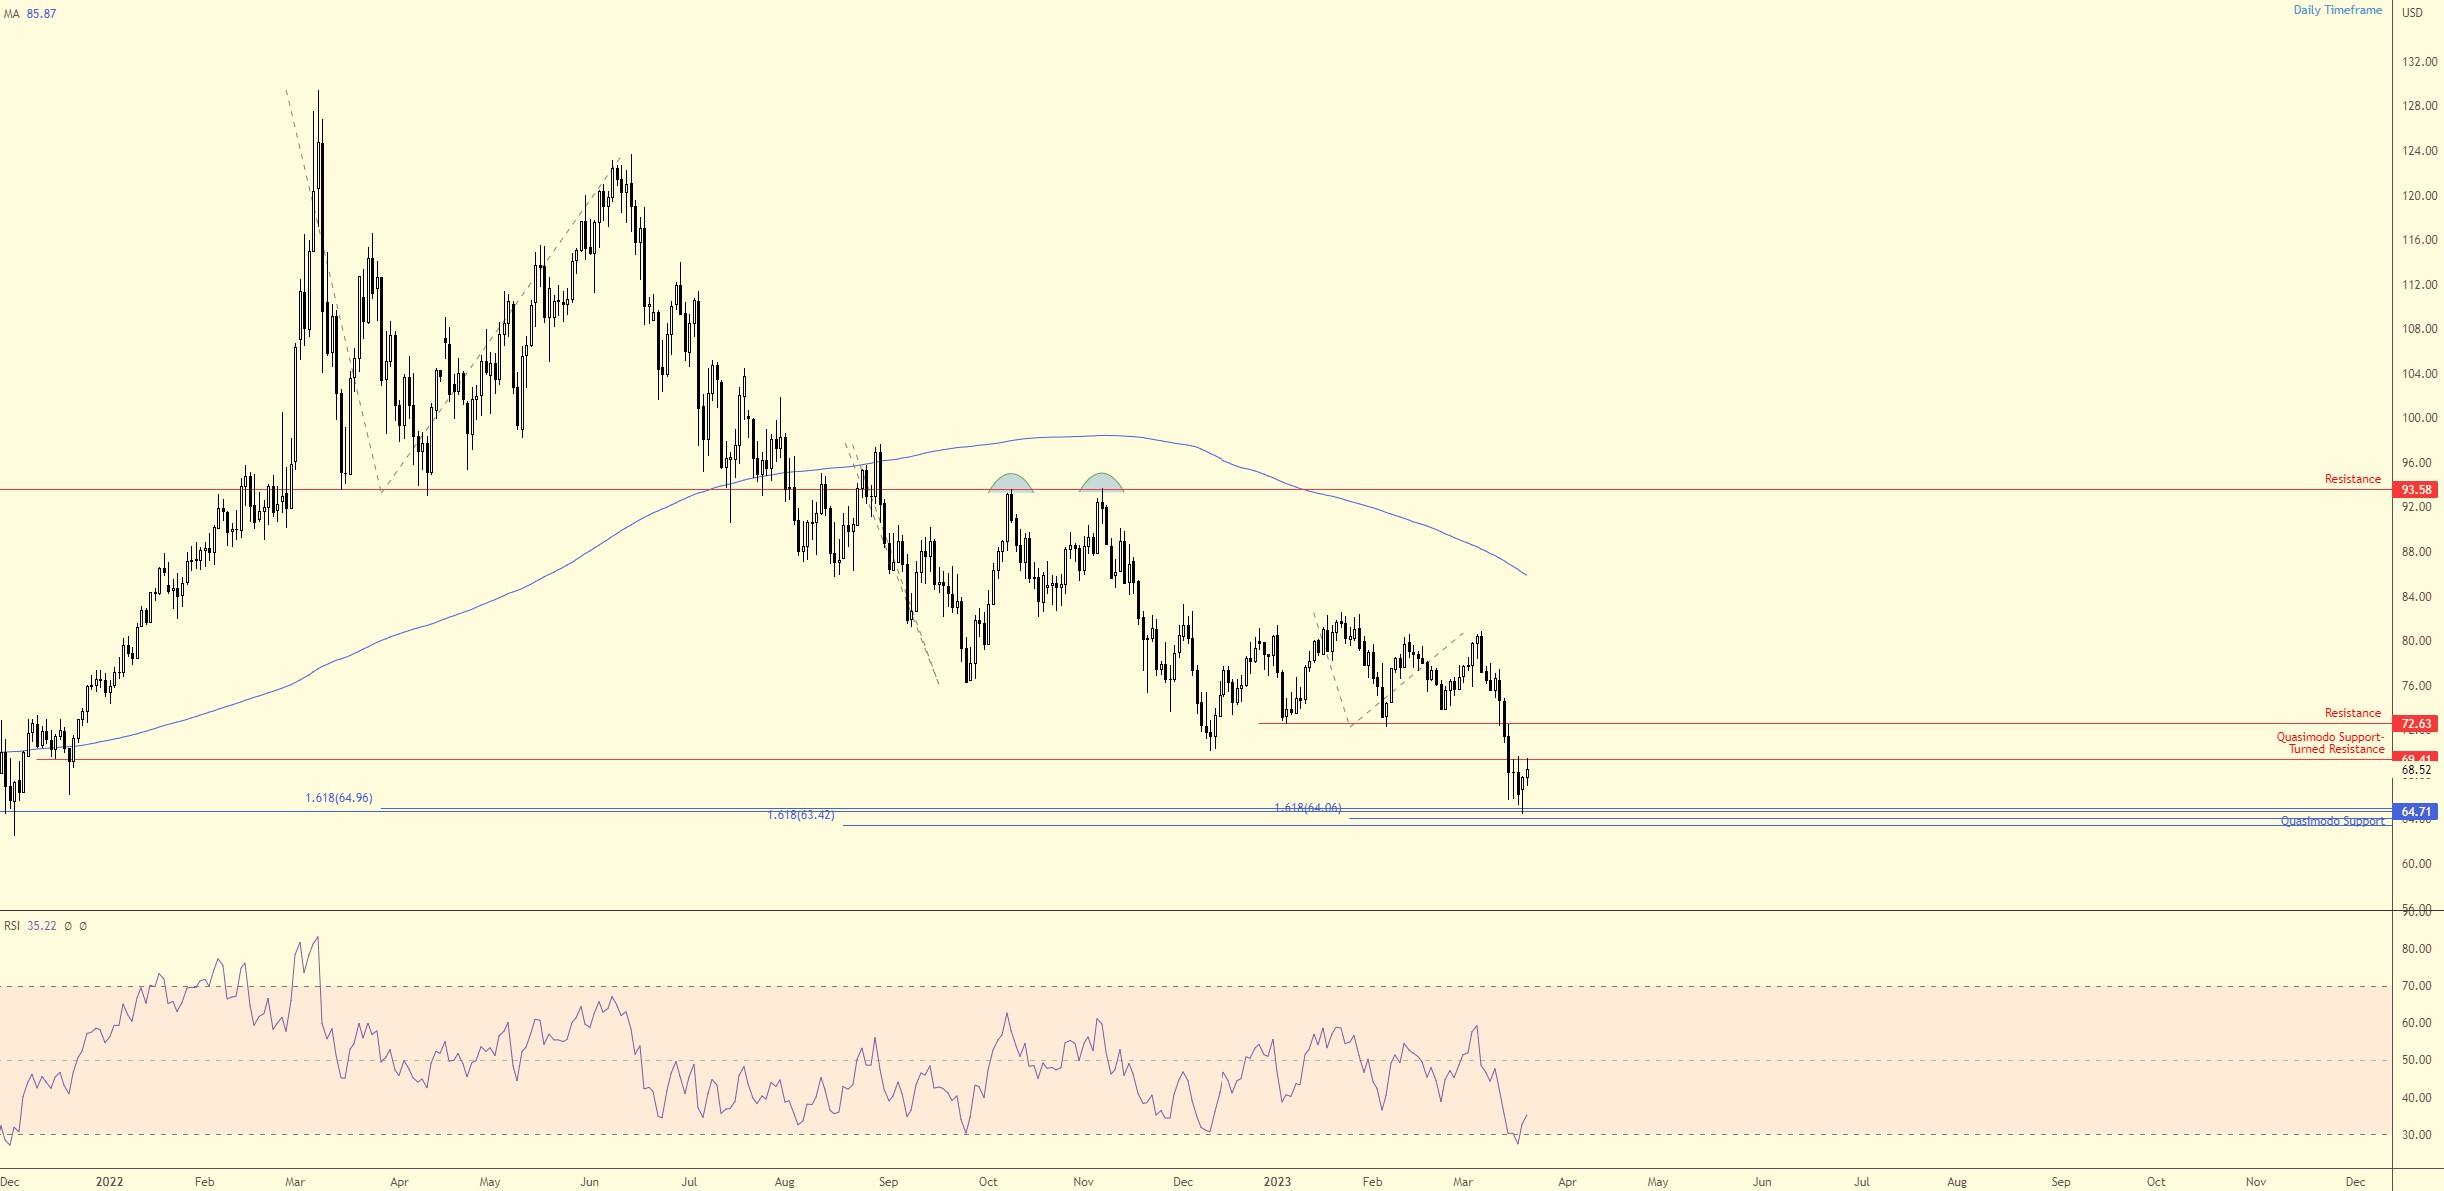
Daily Chart: Support Held Ground; Technical Headwind in Play
The daily chart recently observed a picture-perfect rebound from the support between $63.42 and $64.96, formed from a collection of 1.618% Fibonacci ratios and a Quasimodo support at $67.41. Note that this move was aided by an RSI oversold signal, which was key given that this was the first decisive oversold value since late 2021.
Overhead, however, a potential ceiling is in play at $69.41, a noted upside target in recent analysis. While sellers have reacted to the aforementioned resistance, and the oil market has been in an obvious downtrend since March 2022, the monthly support featured above is a major technical barrier in this market and should not be overlooked.
Therefore, those long from between $63.42 and $64.96 have likely reduced risk to breakeven and perhaps liquidated partial profits. What happens next is important. A $69.41 rejection implies seller intent and a possible continuation of the current downtrend. At the same time, a breakout above the said resistance opens the door for an extension in recovery gains to at least daily resistance coming in at $72.63.
Author

Aaron Hill
FP Markets
After completing his Bachelor’s degree in English and Creative Writing in the UK, and subsequently spending a handful of years teaching English as a foreign language teacher around Asia, Aaron was introduced to financial trading,


