Oil outlook: OPEC pumps the brakes on increasing Oil output

WTI appears to be moving around the $60 per barrel figure. In today’s report we are to have a look at the recent announcement by OPEC, the ongoing US Government shutdown and the US-China trade negotiations, all being on a fundamental level. On a technical level, we are to provide a technical analysis of WTI’s daily chart.
OPEC to pause their Oil output increase
OPEC+ stated on Sunday that they would add another 137,000 barrels per day in December but would halt any further rises in January, February and March. Per the FT, the oil cartel has justified their pause as a result of “seasonality” where oil demand in the first quarter is usually weaker after the end of the holiday season. It appears to us that OPEC+ is worried about ‘drowning’ the market in oil which could result in a reduction of oil prices and thus, despite their plans to regain their lost market share, the oil cartel may need to pump the brakes temporarily to ensure there is adequate demand. In turn the announcement may have provided support for oil’s price due to the reduction of future supply into the market. Moreover, we would like to raise a relatively unorthodox point of view where we raise the question of whether OPEC members are concerned that the Venezuelan government could be toppled, where one could assume that a new leader could lead to closer ties with the US and thus may achieve the easing of oil sanctions on the nation. A reduction of sanctions could allow Venezuelan oil to re-enter the market more freely. Nonetheless, sticking to what we know the moves by OPEC+ are designed to reduce future supply of oil into the market, at least for the first quarter of 2026 and may thus provide some support to oil prices.
US Government shutdown T+37
The US Government shutdown has now entered it’s 37th day and at the time at this report appears poised to continue into the coming week as well. The 37th day anniversary marks the longest government shutdown in the US’s history and could begin to raise concerns over the state of the US economy. In particular, some have claimed that with every week that passes that the US government shutdown, it could cost the economy between $10-$30 billion dollars which could have a tremendous negative effect on the US’s GDP rate. Hence, with the markets attention finally shifting towards the ongoing shutdown and the negative effects which it may lead to in the US economy, oil market participants may be beginning to be taking those worries into account. In particular, a reduction of economic activity in the US could possibly lead to a reduction of oil and thus using a basic economic principle of supply exceeding demand, the price of oil may face downwards pressures. In our view, albeit an unorthodox one yet again, the election of Zohran Mandami may signal to Democratic Senators that the public perception has yet to shift against them and thus with Democratics making gains across the nation, they may not be under immediate pressure to cave into the Republican party’s demands. Hence, we would not be surprised to see the Government shutdown extending possibly towards the end of the month which in turn could weigh on oil prices should concerns over the state of the US economy emerge.
US-China trade relationship thaws following an agreement being reached
Since last Thursday, the US and China have agreed to terms in regards to a prolonged ceasefire trade agreement between the two economic behemoths. Thus given that the markets have already digested this information, we will provide a quick summary of the events which occurred for this particular paragraph. In a nutshell, the US stated that they will suspend the 50% rule for export controls and Beijing stated they will likewise suspend for one year the implementation of its rate earth export controls, amongst other measures, essentially bringing the trade standoff to a temporary end. The effect on the oil market was seen on Thursday, as the threat of a trade war diminished, optimism for a possible increase of manufacturing activity grew which in turn may imply an increase in demand for oil. For now the two sides have stopped sharpening their knives, but considering how quickly opinions and decisions change, we would keep an eye out for any developments.
Technical analysis
WTI Cash daily chart
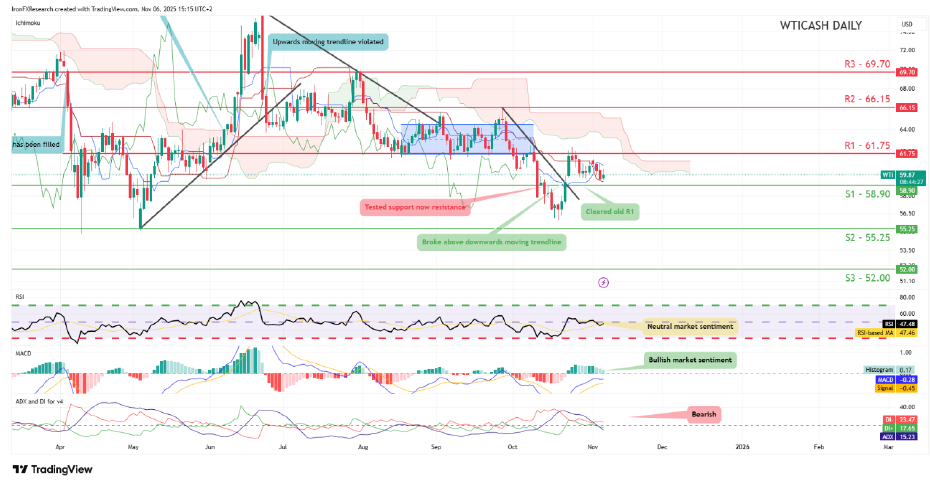
- Support: 58.90 (S1), 55.25 (S2), 52.00 (S3).
- Resistance: 61.75 (R1), 66.15 (R2), 69.70 (R3).
Since our last report WTI’s price appears to have fluctuated around the $60 per barrel figure. For the time being, we would opt for a sideways bias for the commodity’s price and supporting our case is the RSI indicator figure below our chart which currently registers a figure near 50, implying a neutral market sentiment. For our sideways bias to be maintained, we would require the commodity’s price to remain confined between our 58.90 (S1) support level and our 61.75 (R1) resistance line. On the other hand for a bearish outlook we would require a clear break below our 58.90 (S1) support level with the next possible target for the bears being our 55.25 (S2) support line. Lastly, for a bullish outlook we would require a clear break above our 61.75 (R1) resistance level with the next possible target for the bulls being our 66.15 (R2) resistance line.
Author

Phaedros Pantelides
Independent Analyst
Mr Pantelides has graduated from the University of Reading with a degree in BSc Business Economics, where he discovered his passion for trading and analyzing global geopolitics.


