Oil outlook: Oil prices stabilise, yet bearish tendencies may emerge

Since our last report oil prices seem to have relatively stabilised. In today’s report we are to discuss some fundamental issues which affect or could affect oil prices and are related to the supply and the demand of the international oil market. We are to compliment the fundamentals with a technical analysis of WTI’s daily chart.
Bearish signals in the US Oil market intensify
Having a look at the US oil market we note that the number of active oil rigs in the US, as per Baker Hughes, ticked down to 473 if compared to prior report’s reading of 474. The drop was interpreted as a bearish signal as it implies that reduced oil demand may have forced oil producers to shut down an oil rig. On Tuesday API reported an increase of US oil inventories, by almost 2.5 million barrels, a figure which is lower than last week’s reading of a 4.287 million barrel increase. In any case, the increase of oil inventories as reported by API may have disappointed oil traders, as a reduction of US oil inventories was expected. Similarly, on Wednesday EIA also reported a narrowed increase of US oil inventories of 1.328 million barrels, also surprising the markets. Overall both API and EIA signalled that oil production levels for another week, have surpassed aggregated oil demand in the US, thus sending bearish signals for oil prices. We should note at this point that analysts tended to blame a modest demand for the commodity as well as increased imports of oil that allowed for the commodity’s inventories to rise in the US market. Thus should we see further signals of an easing US oil market in the coming week, we may see bearish tendencies for oil prices intensifying in the coming week. On the flip side, any signs of a possible tightening of the US oil market, such as reports of drawdown in US oil inventories by API and EIA could provide some support for oil prices.
Israel to hit Iranian nuclear facilities?
According to CNN, the US has obtained new intelligence which suggests that Israel is preparing to strike Iranian nuclear facilities. It should be noted that the reports are coming in as the US is preparing to strike a possible diplomatic deal with Iran, a scenario which could ease market worries for the supply side of the international oil market and in turn could weigh on oil prices. We expect Israel’s actions to depend largely also on the Israeli expectations of how the US-Iranian talks proceed, while also what the reaction of the US could be to such a strike. It’s clear that such a strike would not go down well with US President Trump unless it’s sanctioned by the US. On the flip side, Israel may prefer to proceed with a strike before the US gets a deal with Iran in a sort of pre-emptive strike, as a possible US-Iranian deal could allow for the Iranian nuclear program to stay alive, a scenario that Israel tries to end. Furthermore a possible Israeli strike on Iranian nuclear facilities could pose a substantial escalation in the Middle East, an escalation which possibly would not be unanswered by Iran, thus leading to a negative spiral. Should we see Israel attacking Iranian nuclear sites, we may see oil prices rallying as market worries for the supply side of oil could skyrocket.
Oil demand and OPEC’s intentions
On the positive side, OPEC’s Secretary General Haitham Al Ghais said on Tuesday that he organisation remains generally optimistic about oil demand despite there being some headwinds recently. The difficulties tend to focus around risks for international trade and a possible slow down of the global economy. OPEC expects global demand to grow by 1.3 million barrels per day (bpd) for 2025 and in 2026, a rather optimistic scenario. At the same time though such expectations for the demand side of the international oil market may justify also OPEC’s intentions to increase oil production levels, which could have a bearish effect on oil prices as the supply side of the international oil market may widen in the coming months, a prospect that may have been fuelling oil bears in the past few days.
Technical Analysis
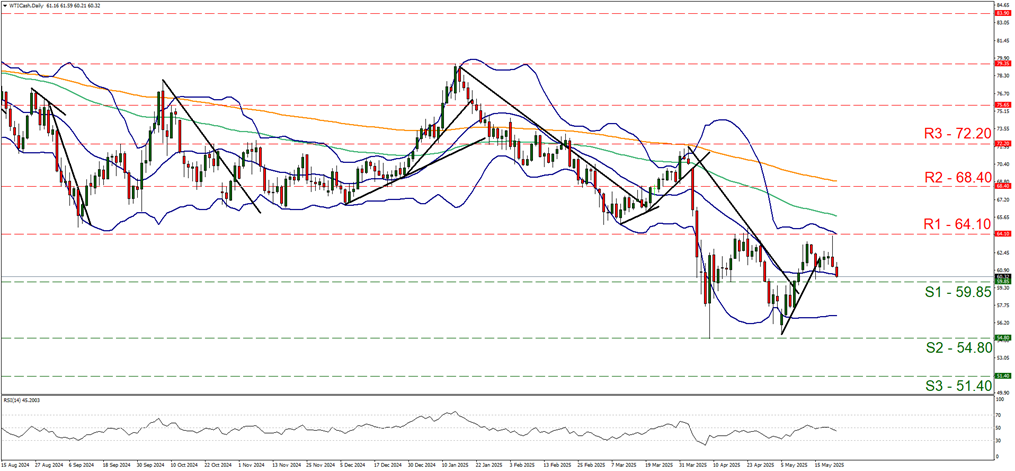
WTI cash daily chart
-
Support: 59.85 (S1), 54.80 (S2), 51.40 (S3).
-
Resistance: 64.10 (R1), 68.40 (R2), 72.20 (R3).
WTI’s price dropped yesterday and during today’s Asian and European session, aiming for the 59.85 (S1) support line. The RSI indicator despite edging lower continues to be just below the reading of 50, remaining unconvincing for a possible bearish market sentiment among market participants for the commodity’s price. Furthermore the Bollinger bands despite remaining relative wide, is flat implying some stabilisation of WTI’s price action. Given also that the price action has interrupted its upward movement underscored by the breaking of the upward trendline active since the 5th of May, we switch our bullish outlook in favour of a sideways motion bias. Should the bears take over, we may see the commodity’s price breaking the 59.85 (S1) support line and continue lower aiming for the 54.80 (S2) support level. On flip side, should the bulls get in the driver’s seat, we may see WTI’s price reversing today’s and yesterday’s losses and breaking the 64.10 (R1) resistance line clearly, thus paving the way for the 68.40 (R2) resistance hurdle.
Author

Peter Iosif, ACA, MBA
IronFX
Mr. Iosif joined IronFX in 2017 as part of the sales force. His high level of competence and expertise enabled him to climb up the company ladder quickly and move to the IronFX Strategy team as a Research Analyst. Mr.


