Oil and Gold: Price review for the week ahead

This preview of weekly data examines USOIL and XAUUSD, with economic data expected later this week as the primary market drivers of the near-term outlook.
Highlights of the week: German and EU inflation, US manufacturing and job report
Tuesday
- Preliminary German inflation rate at 12:00 GMT. The market consensus for June is for a decline of around 0.1%, reaching 2.5%. If this is broadly accurate, then it could most probably influence the European inflation figure on the following day.
Wednesday
- Flash European inflation rate at 09:00 AM GMT. The rate for June is expected to decline to 3%, down from the previous reading of 3.2%. This could negatively affect the Euro against its pairs, at least in the short term.
- US manufacturing PMI at 14:00 GMT. The consensus for June is for a decrease from 54 to 53.7 points. Even though the expectations are for a slight decline, the manufacturing sector in the United States is holding above the 50-basis point, meaning that the sector is still expanding and holding strong, supporting the dollar.
Thursday
- US Job report at 12:30 GMT, where the non-farm payrolls and unemployment rate are going to be published. The expectations for the NFP are for a decline to reach 114,000 against the previous recording of 172,000. If these expectations are correct, we might see that the dollar could move down in various pairs in the aftermath of the release. On the other hand, the unemployment rate is expected to remain static at 4.3%.
USOIL, daily
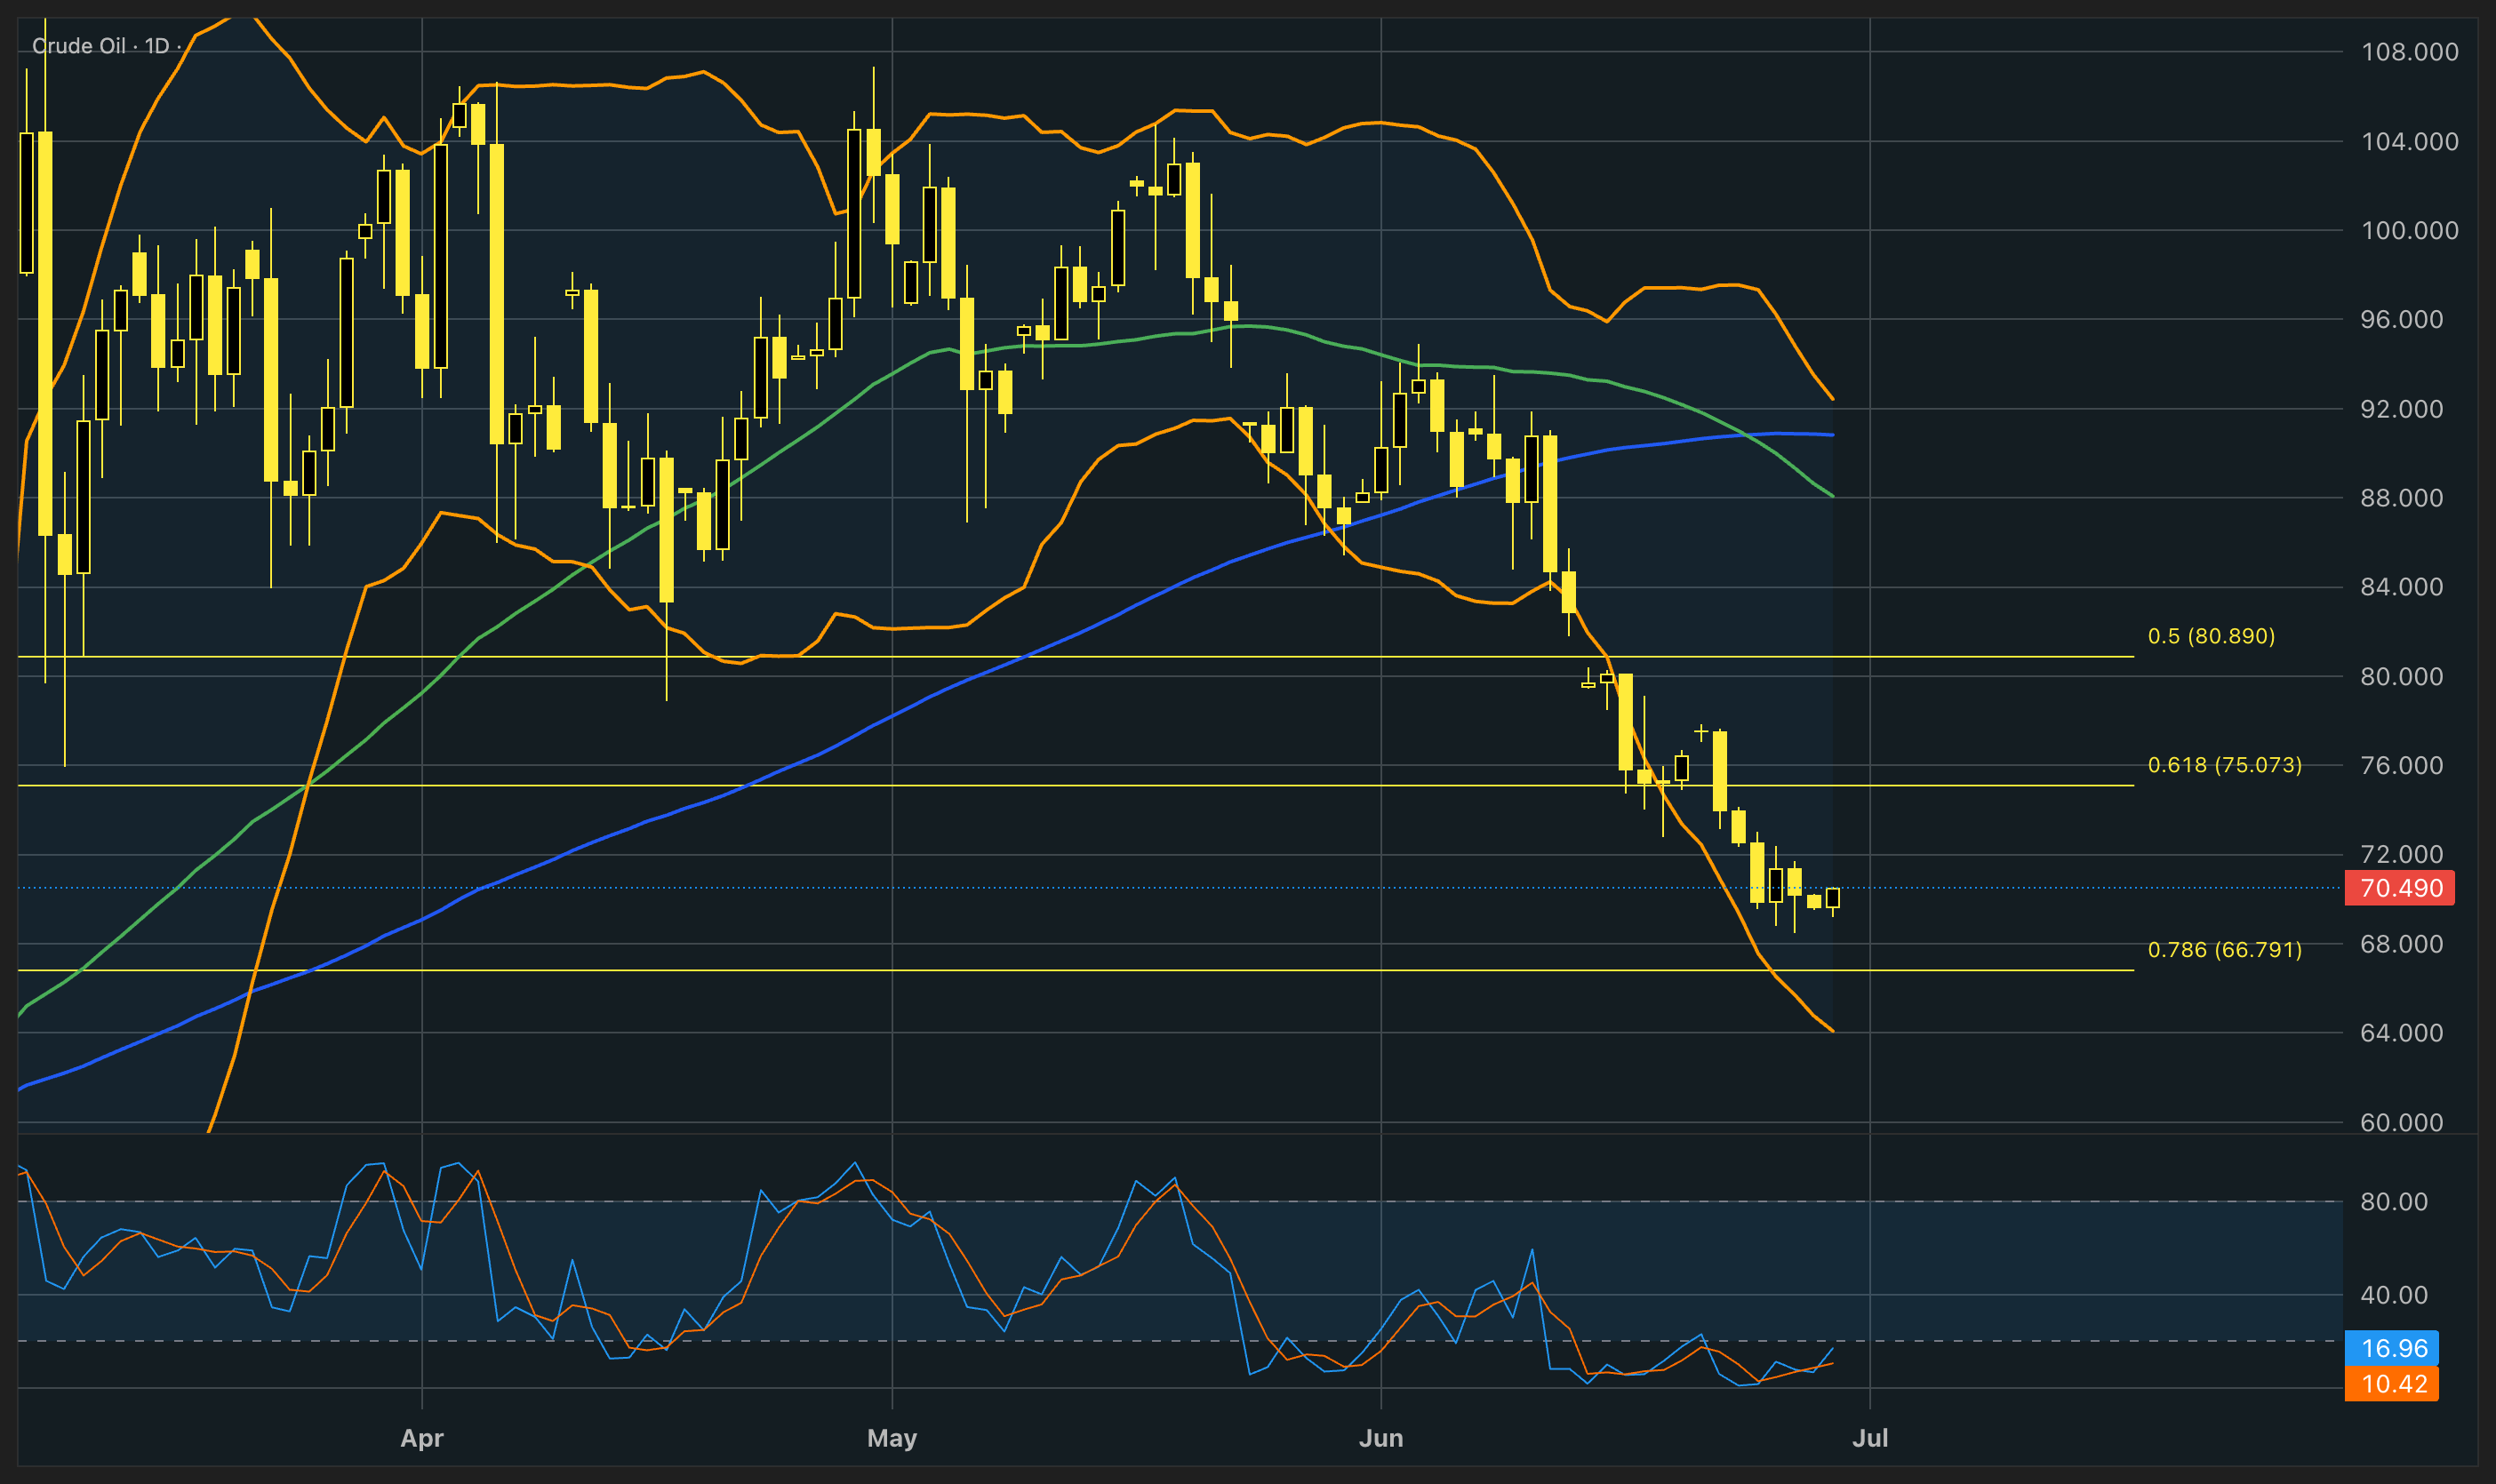
Oil remained near recent lows as the US and Iran agreed to pause attacks, easing concerns over further escalation in the Middle East. The agreement allows vessels to move through key shipping routes while peace talks are set to resume. Prices have given back most gains seen since the conflict began, as markets view recent moves as temporary rather than a major shift in supply conditions. However, uncertainty remains, with some vessels still delayed and shipowners cautious about operating in the region. A potential long-term peace agreement could support a full reopening of major energy routes, while additional supply risks remain from disruptions elsewhere, including possible fuel export restrictions from Russia.
Crude oil remains in a clear downtrend that started in mid-May, with price now pressing against the $70 support area. The moving averages have confirmed the bearish structure through a recent crossover, reinforcing downside momentum. The Stochastic oscillator has stayed in deeply oversold territory for nearly two weeks, which technically opens the door for a short-term relief bounce. However, momentum remains weak, so any upside reaction is likely to be limited rather than a trend reversal. Volatility has also picked up, with widened Bollinger Bands reflecting more aggressive price swings. If downside pressure continues, the next key support sits near $65, aligned with the lower Bollinger Band and just below the 78.6% Fibonacci retracement level on the monthly structure.
Gold-Dollar, daily
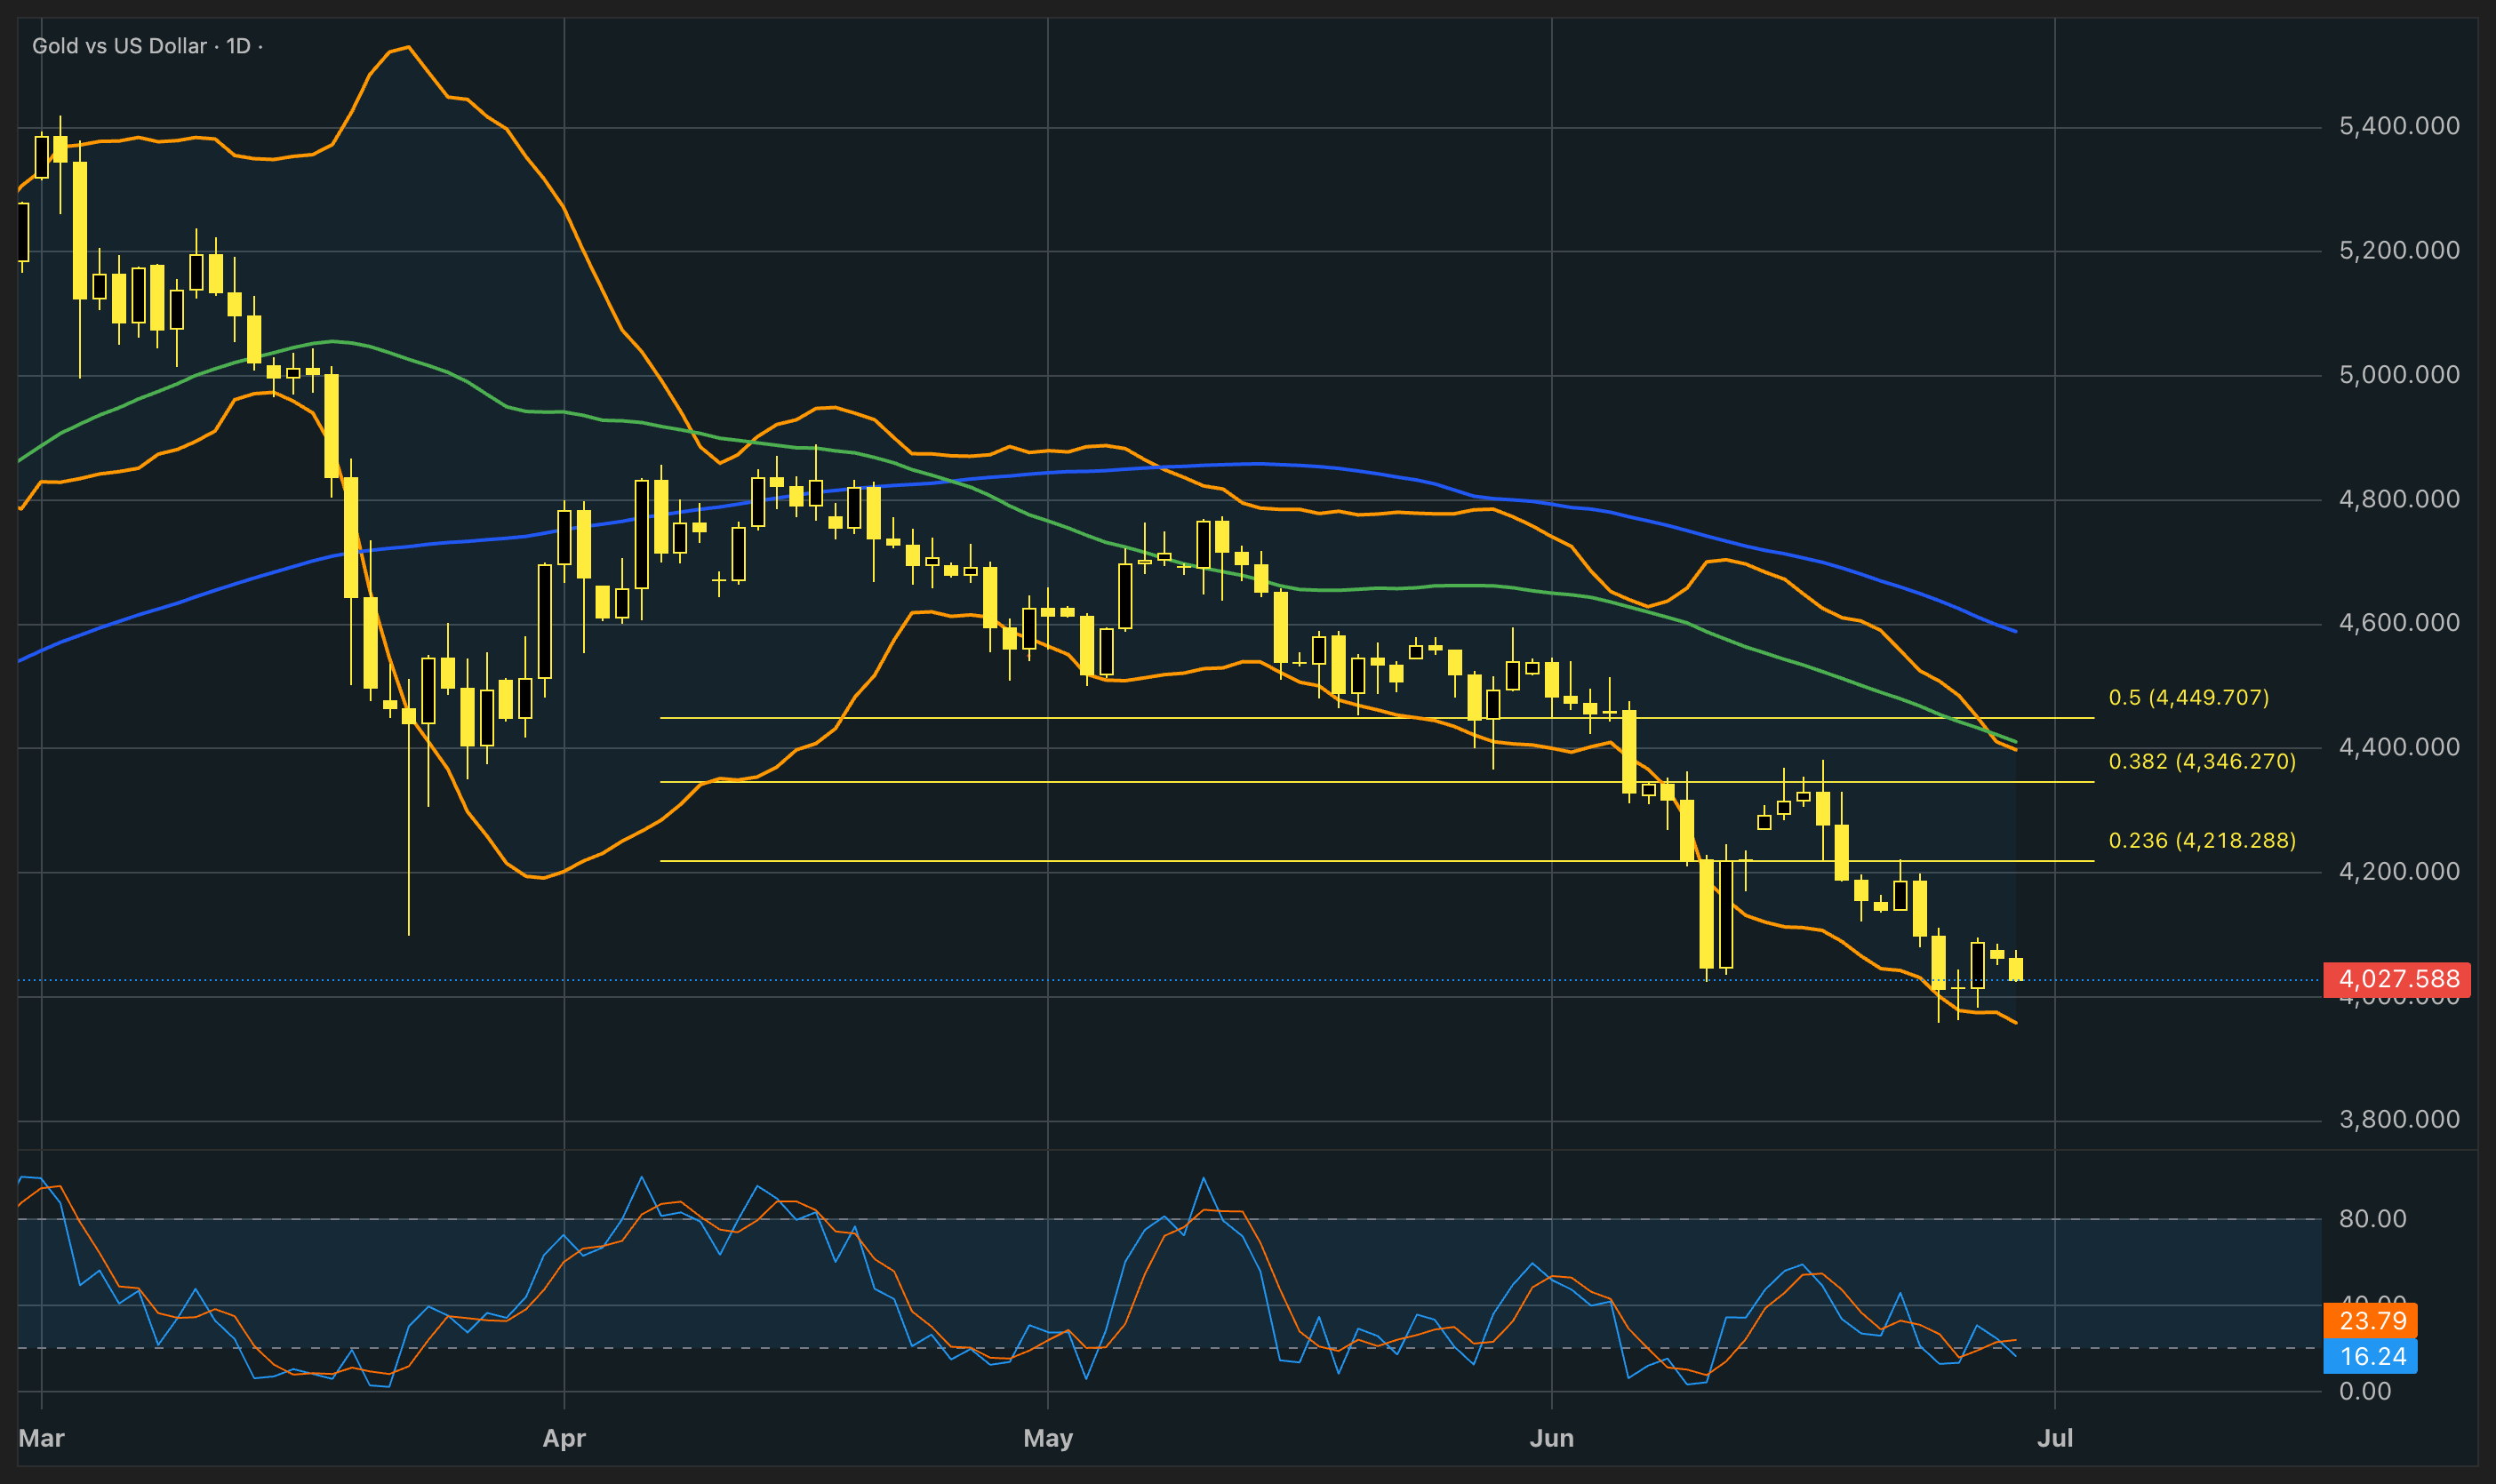
Gold declined toward $4,000 an ounce as renewed US-Iran tensions pressured markets and reduced expectations for near-term interest-rate hikes. The drop followed a strong rebound in the previous sessions. A tanker incident in the Persian Gulf disrupted shipping and initially pushed energy prices higher, but prices later eased after the US and Iran agreed to halt attacks ahead of renewed peace talks. Despite the decline, gold remained above the $4,000 level, suggesting some investors are still viewing it as attractive. However, the metal has fallen significantly since the conflict began, as higher energy costs increased inflation concerns and supported expectations of prolonged higher interest rates.
From a technical standpoint, gold recently bounced off the lower Bollinger Band but is now drifting back toward a retest of the $4,000 support zone. The moving averages continue to point lower, keeping the broader trend biased to the downside. The Stochastic oscillator remains deeply oversold, which allows for short-term rebounds, but does not yet point to a meaningful trend reversal. Expanded Bollinger Bands indicate elevated volatility, so sharp moves in either direction remain possible. That said, in the absence of a strong catalyst, downside continuation remains the more likely path, particularly if macro conditions reinforce the bearish pressure. For now, $4,000 stands as the key support level, and price reaction around this area will be crucial for the next directional move.
Author

Antreas Themistokleous
Exness
Antreas has been trading CFDs since 2018 using a combination of fundamental and technical analysis.


