EUR/JPY takes a swift upturn [Video]
![EUR/JPY takes a swift upturn [Video]](https://editorial.fxstreet.com/images/Markets/Currencies/Crosses/EURJPY/computer-keyboard-with-currency-pair-eur-jpy-button-49017434_XtraLarge.jpg)
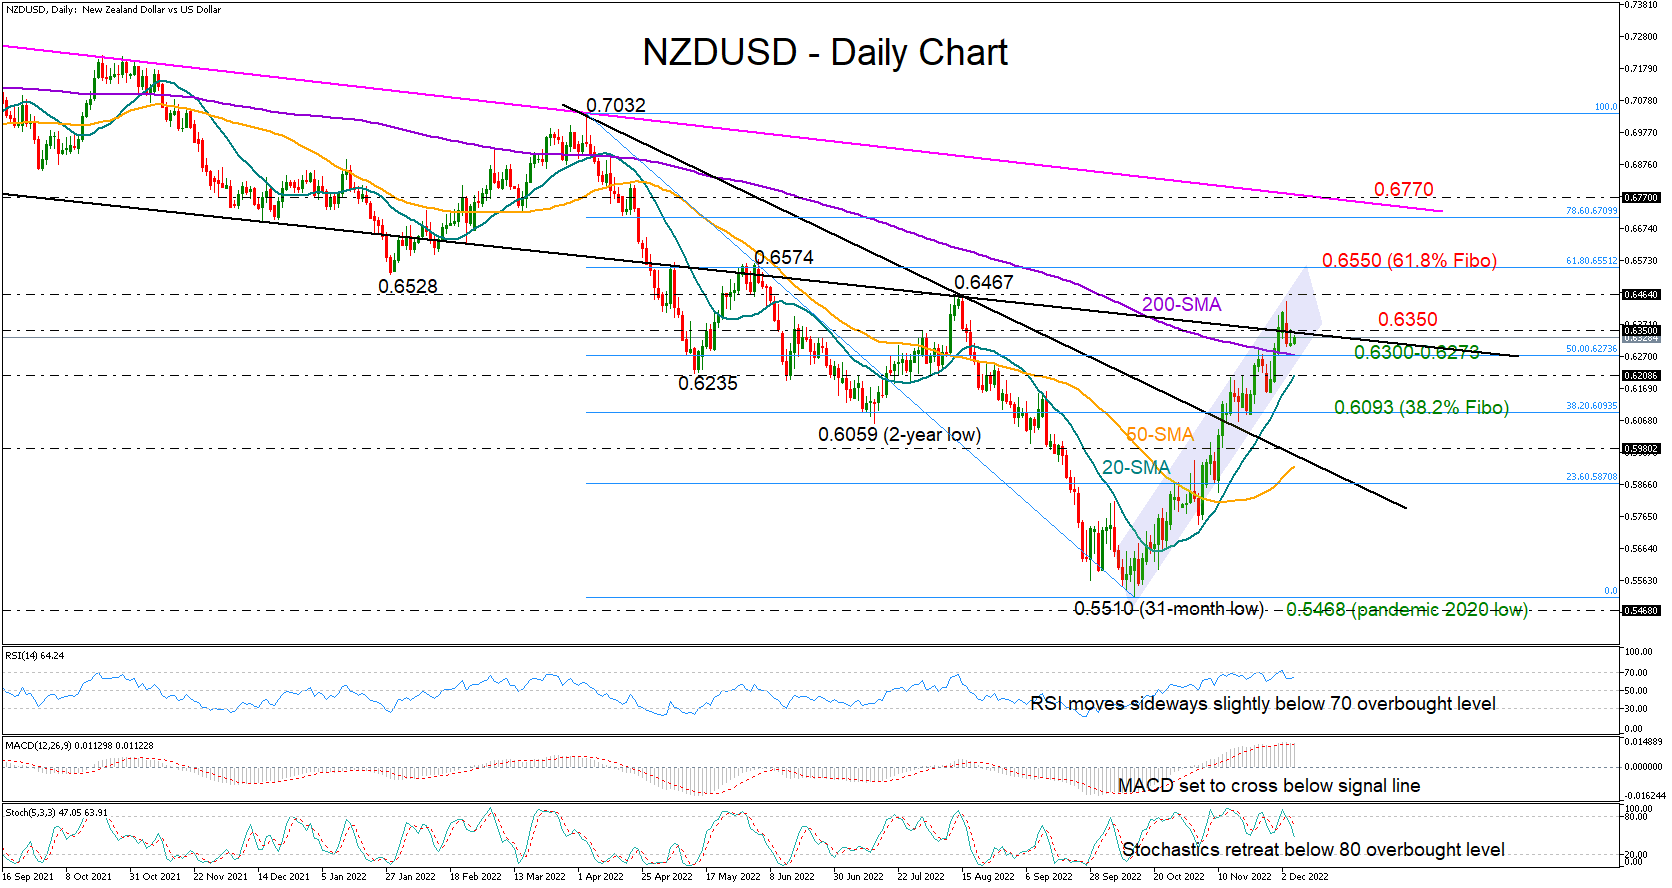
NZD/USD in a wait-and-see mode
NZDUSD came under pressure marginally below the August high of 0.6467 at the start of the week, having gained almost 15% since the bottom at a 31-month high of 0.5510 in mid-October.
Market sentiment may remain tepid, according to the momentum indicators. With the RSI losing steam near its 70 overbought mark, the stochastics struggling to post new highs above 80, and the MACD set to cross below its red signal line, a downside correction cannot be ruled out.
The bearish scenario, however, may not come into play unless the price retreats below the 0.6300 round-level and the 200-day simple moving average (SMA), which currently overlaps with the 50% Fibonacci retracement of the 0.7032-0.5510 downleg. The 20-day SMA could next support the market around 0.6212. If selling forces dominate, the decline could stretch towards the 38.2% Fibonacci of 0.6093.
Alternatively, a close above the 0.6350 barrier could get an extension towards the August resistance area of 0.6467. Slightly higher, the 61.8% Fibonacci of 0.6550 could be another spot to keep a close eye. A successful move above that bar may stage a quick rally towards the crucial long-term descending trendline that joins all the highs from February 2021 at 0.6770.
In brief, NZDUSD is in a neutral mode in the short-term picture, waiting for a new direction either above 0.6350 or below 0.6300-0.6273.
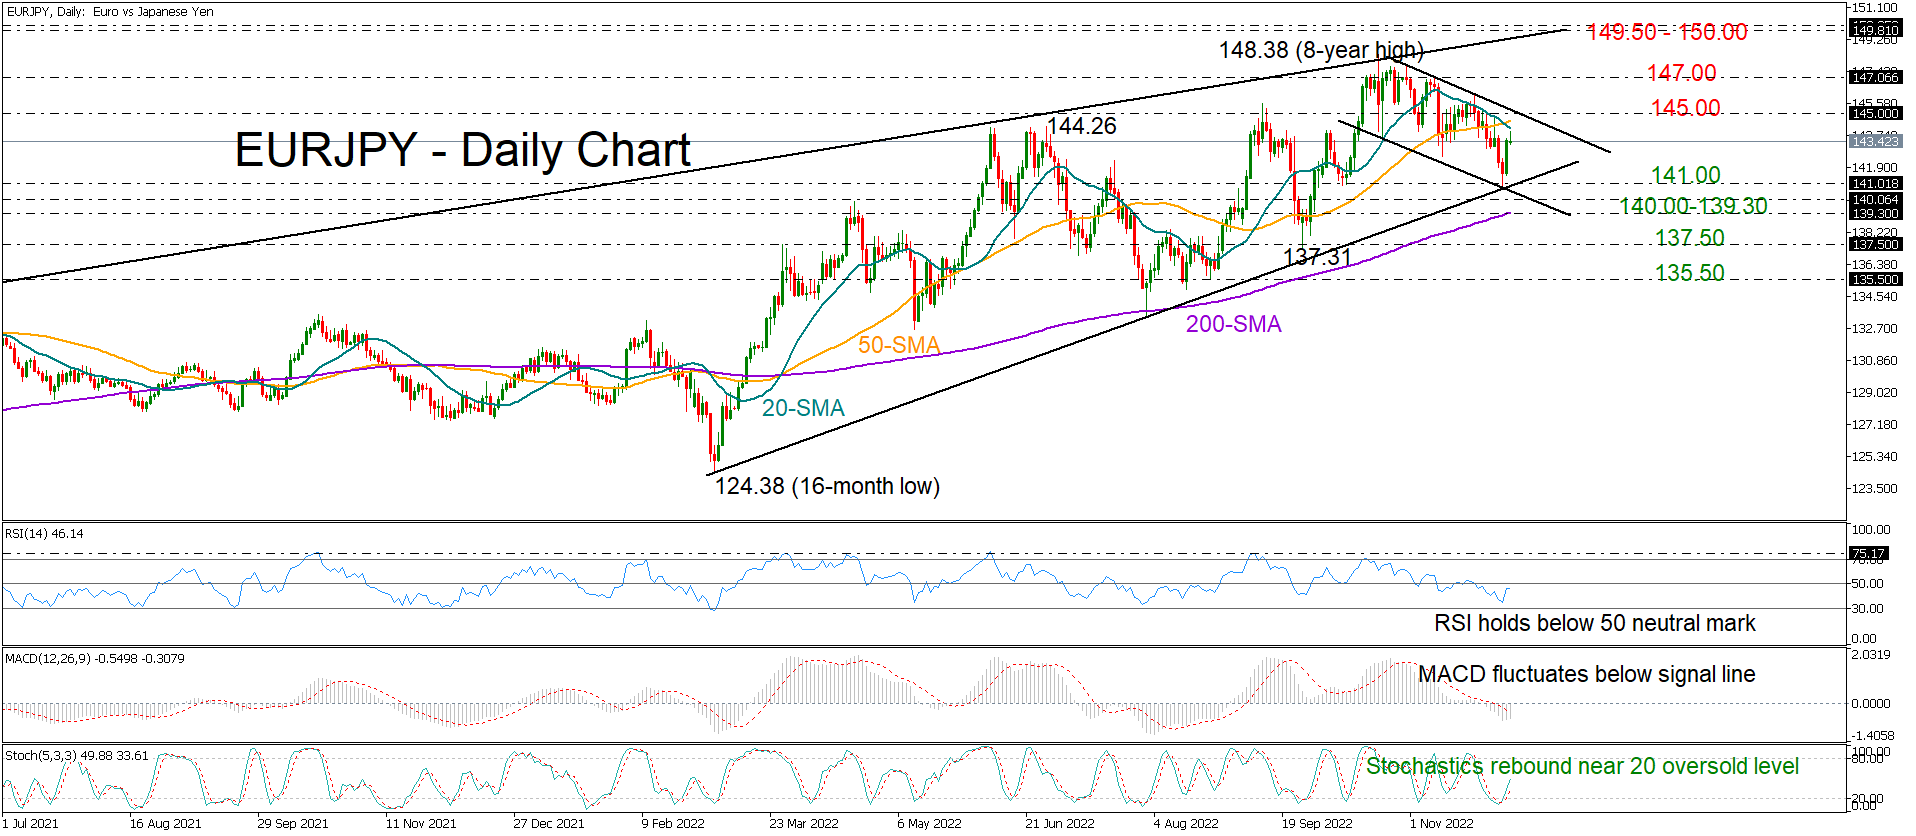
EUR/JPY takes a swift upturn, but risks remain
EURJPY drifted higher after stepping on the key support trendline that comes from the March lows at 140.75.
Despite the swift upturn in the price, the RSI could not exit the bearish territory, while the MACD was unable to climb above its red signal line, both mirroring some persisting skepticism in the market.
In the short-term picture, the pair has been trading within a downward-sloping channel since the peak at an eight-year high of 148.38. Hence, for buying interest to grow, the price will need to overcome its 20- and 50-day simple moving averages (SMAs) and exit the bearish tube above 145.00. If efforts prove successful, the door will open for the 147.00 resistance. Another move higher could trigger a rally towards the crucial long-term resistance line that joins all the highs from August 2020, currently seen within the 149.50-150.00 region.
Should selling tendencies resurface, the spotlight will fall again on the ascending trendline around 141.00. Failure to pivot here may confirm an extension towards the channel's lower boundary seen near 140.00 and the 200-day SMA, while a steeper decline could reach the 137.50 constraining zone. If the bearish wave worsens, the next rebound could take place around 135.50.
In brief, the latest quick bounce in EURJPY could not switch the bias to the positive side. For that to happen, the price will need to advance above 145.00.
Author

Christina joined the XM investment research department in May 2017. She holds a master degree in Economics and Business from the Erasmus University Rotterdam with a specialization in International economics.


