NZD: Waiting for a directional sign?

The risk-on vibe in global stock markets was boosted by a strong set of data out of China this week and strong Labor data out of Australia overnight, which gave buoyancy to the Australian and Canadian dollars.
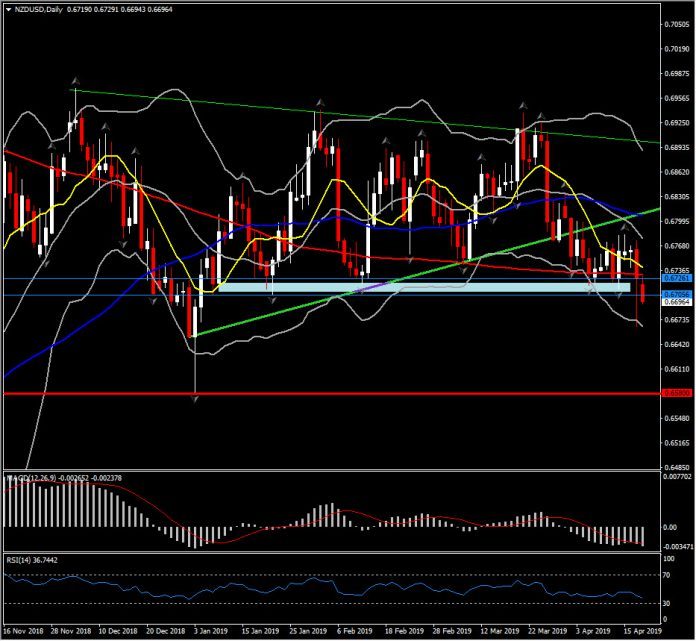
However as Aussie outperforms, the sub-forecast CPI data our of New Zealand yesterday have underpinned the New Zealand Dollar, and sent NZDUSD to a 3-month low at 0.6665. Since November, the 0.6700 has been a key Support level for the asset. Eventhough, yesterday Kiwi’s bulls manage to lift it back above the 0.6700 hurdle, this sharp decline along with the continuous drop of the pair for a 4th week in a row (outside of a descending triangle), strengthens negative bias.
The pair holds for a 2nd consecutive day below 200-DSMA, while its been below 10-, 20- and 50-day SMA since March 27. This along with the Moving averages pointing to the downside and momentum indicators being negatively configured, suggest more possible losses in the near and medium term picture.
The RSI indicator is looking south, while MACD is keep extending in the negative area, impliyng to a rising negative momentum.
Hence a confirmed close below 0.6700, could propose the end of the sideways movement as the bears have taken the control of the market. therefore the doors towards January’s low at 0.6580 level will open.
On the flip-side, a rebound could face an immediate Resistance at 20-day SMA and week’s peak, at 0.6770-0.6780 area.
Author

Having completed her five-year-long studies in the UK, Andria Pichidi has been awarded a BSc in Mathematics and Physics from the University of Bath and a MSc degree in Mathematics, while she holds a postgraduate diploma (PGdip) in


