NZD/USD – Parabolic Move Into LT Resistance

Price Action Context
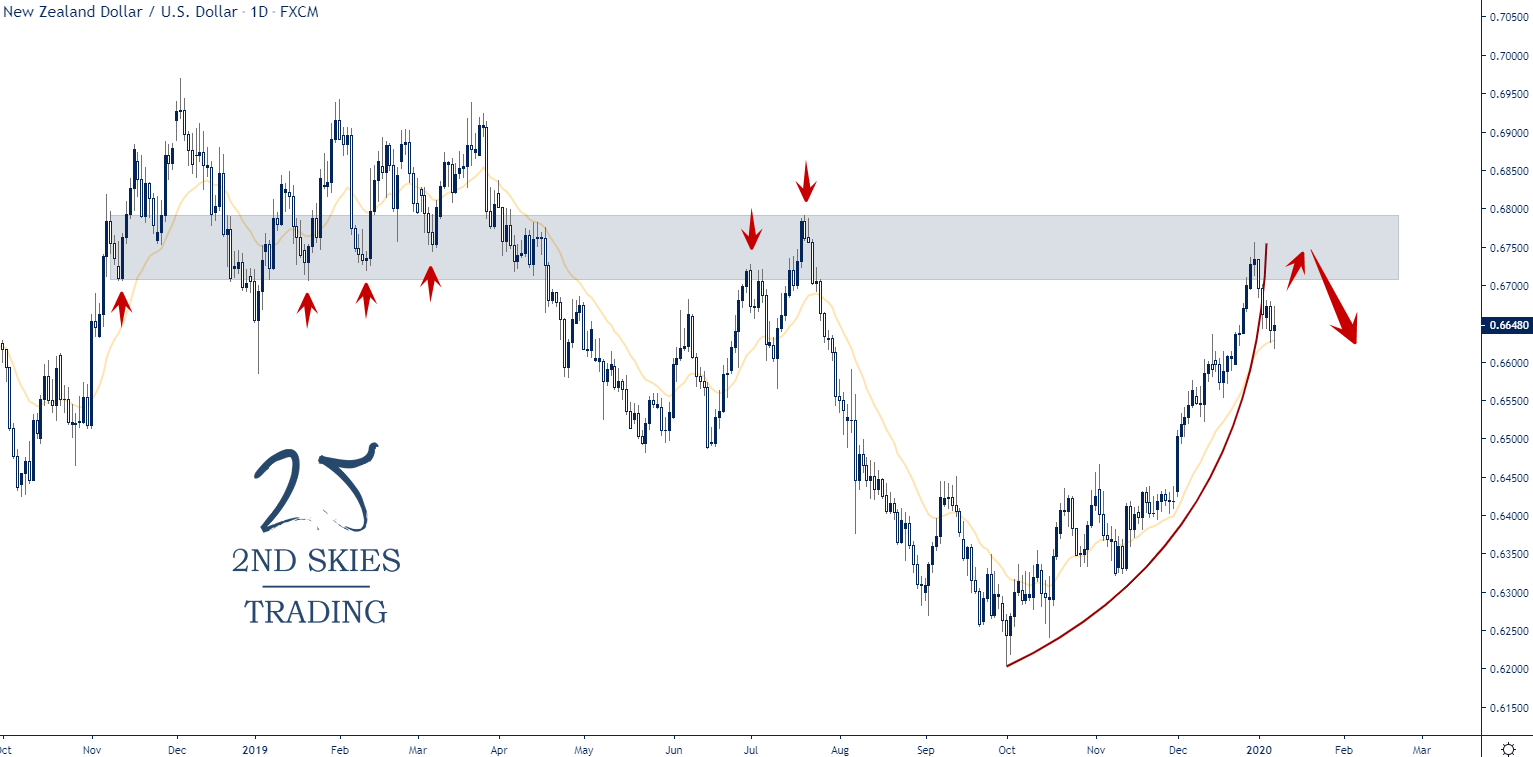
The strong 500+ pip bull run that started in October last year took the kiwi all the way from 0.67 to 0.73 in roughly 3 months’ time. The move accelerated from the middle towards the end, producing a parabolic move leading up to a long-term resistance, suggesting a potential short-term exhaustion.
Trending Analysis
Our LT bias currently is neutral, and bears can look for potential short-term selling opportunities on strength into the long-term resistance with the closest key support starting to come in at around 0.65.
Key Support and Resistance Zones
R: 0.6700 – 0.6790
S: 0.6425 – 0.6500
Visit our website at 2ndSkies for more price action content, free trading lessons, strategies and videos. Find out how we can help you to change the way you think, trade and perform.
Visit our website at 2ndSkies for more price action content, free trading lessons, strategies and videos. Find out how we can help you to change the way you think, trade and perform.
Author

Chris Capre
2ndskiesforex
Chris Capre is a professional forex trader and mentor specialized in Price Action trading, and the Ichimoku Cloud.


