NZD/JPY produced a doji candle on the daily chart yesterday. The H4 chart shows that the price after being bearish for a while has been having consolidation. A flipped level of resistance has already produced a bearish inside bar. If the price makes a breakout at today's lowest low, the sellers may go short in the pair.


Chart 1 NZD/JPY H4 Chart

NZDJPY

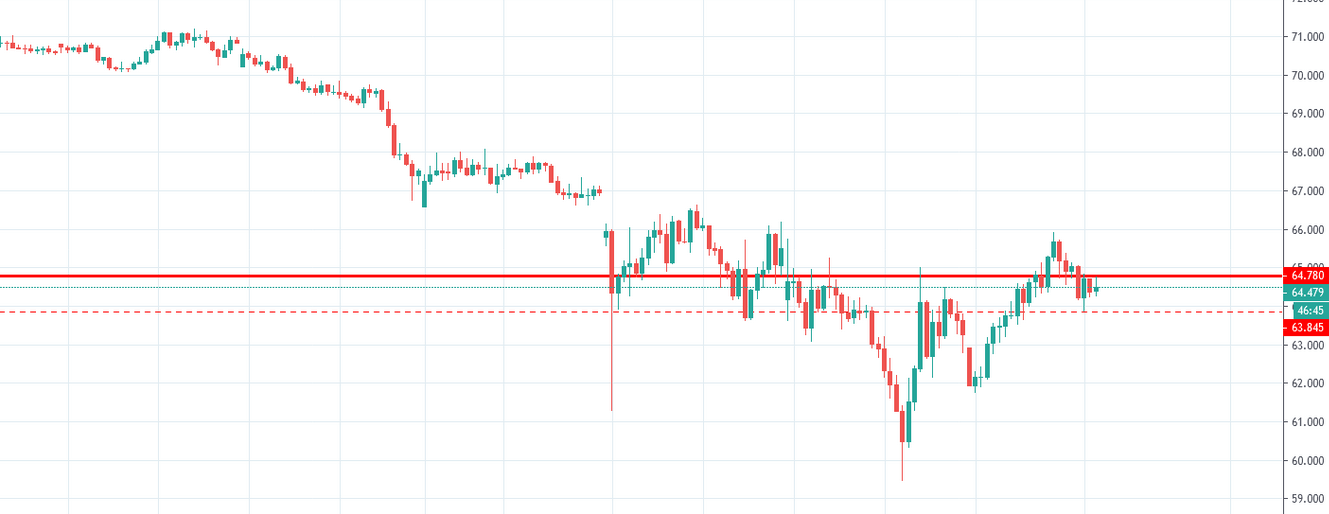
The chart shows that the price produced a bearish engulfing candle and headed towards the South. It had a bounce at the level of 64.845 and produced a bullish corrective candle. The next candle came out as a bearish inside bar. As of writing, the price has been roaming around the level of resistance. If it comes down and makes a breakout at the level of 63.845, it may head towards the South with good bearish momentum.


Trade Summary

Entry: Sell below 63.845

Stop Loss: Above 64.780

Take Profit 1: 63.350

Take Profit 2: 63.065

Take Profit 3: 62.530


Try Secure Leveraged Trading with EagleFX!

Risk Warning: CFD and Spot Forex trading both come with a high degree of risk. You must be prepared to sustain a total loss of any funds deposited with us, as well as any additional losses, charges, or other costs we incur in recovering any payment from you. Given the possibility of losing more than your entire investment, speculation in certain investments should only be conducted with risk capital funds that if lost will not significantly affect your personal or institution’s financial well-being. Before deciding to trade the products offered by us, you should carefully consider your objectives, financial situation, needs and level of experience. You should also be aware of all the risks associated with trading on margin.

Recommended Content


Recommended Content

Editors’ Picks

AUD/USD could extend the recovery to 0.6500 and above

AUD/USD could extend the recovery to 0.6500 and above

The enhanced risk appetite and the weakening of the Greenback enabled AUD/USD to build on the promising start to the week and trade closer to the key barrier at 0.6500 the figure ahead of key inflation figures in Australia.

AUD/USD News

EUR/USD now refocuses on the 200-day SMA

EUR/USD now refocuses on the 200-day SMA

EUR/USD extended its positive momentum and rose above the 1.0700 yardstick, driven by the intense PMI-led retracement in the US Dollar as well as a prevailing risk-friendly environment in the FX universe.

EUR/USD News

Gold struggles around $2,325 despite broad US Dollar’s weakness

Gold struggles around $2,325 despite broad US Dollar’s weakness

Gold reversed its direction and rose to the $2,320 area, erasing a large portion of its daily losses in the process. The benchmark 10-year US Treasury bond yield stays in the red below 4.6% following the weak US PMI data and supports XAU/USD.

Gold News

Bitcoin price makes run for previous cycle highs as Morgan Stanley pushes BTC ETF exposure

Bitcoin price makes run for previous cycle highs as Morgan Stanley pushes BTC ETF exposure

Bitcoin (BTC) price strength continues to grow, three days after the fourth halving. Optimism continues to abound in the market as Bitcoiners envision a reclamation of previous cycle highs.

Read more

US versus the Eurozone: Inflation divergence causes monetary desynchronization

US versus the Eurozone: Inflation divergence causes monetary desynchronization

Historically there is a very close correlation between changes in US Treasury yields and German Bund yields. This is relevant at the current juncture, considering that the recent hawkish twist in the tone of the Federal Reserve might continue to push US long-term interest rates higher and put upward pressure on bond yields in the Eurozone. 

Read more

Majors

Cryptocurrencies

Signatures