|

NZD/CAD Stalls At A Technical Juncture Ahead of CAD CPI

The past few weeks has seen NZD have the upper hand over its commodity FX rival, CAD. Yet it could be approaching crunch time as yesterday’s high almost perfectly bounced of a 2-year trendline (just in time of Canada’s data dump today).

NZDUSD

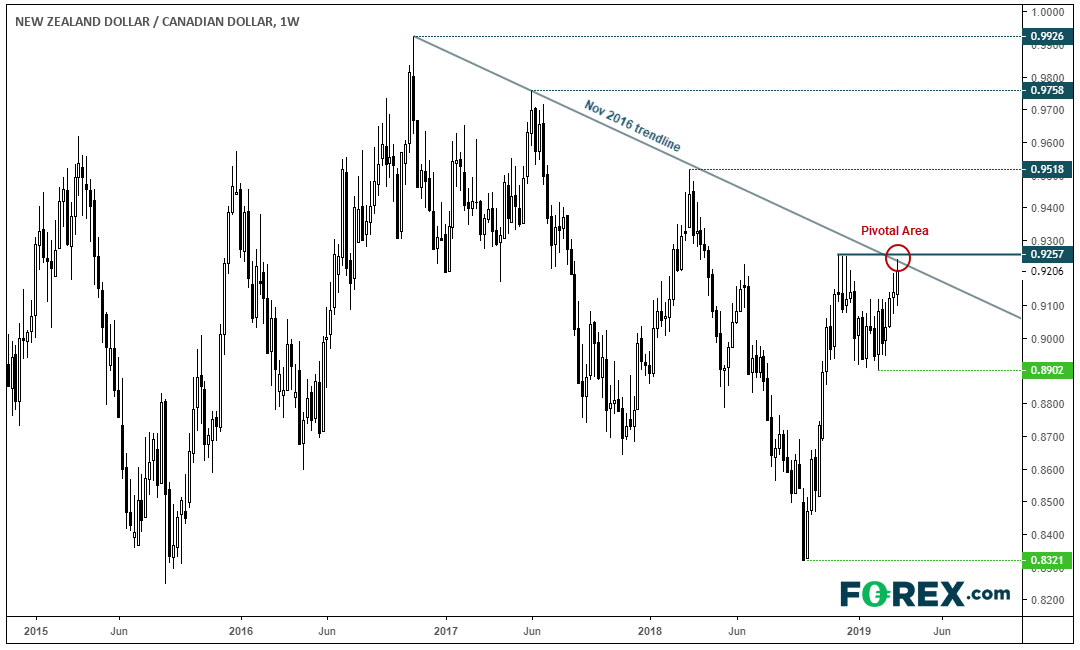
The weekly chart shows resistance has been found at pivotal level. If the November 2016 trendline holds and bearish momentum is to return, it could see a resumption of its 2-year trend over the coming weeks. However, the daily chart has its merits for the bull-camp.

The rally from 0.8320 appears impulsive, and the retracement from 0.9572 respected the 38.2% Fibonacci retracement, prior to re-testing the December highs. Moreover, the 8, 21 and 50 eMA’s are fanning out to show an increase in momentum, and recent retracements have found dynamic support with the shorter averages.

NZDUSD

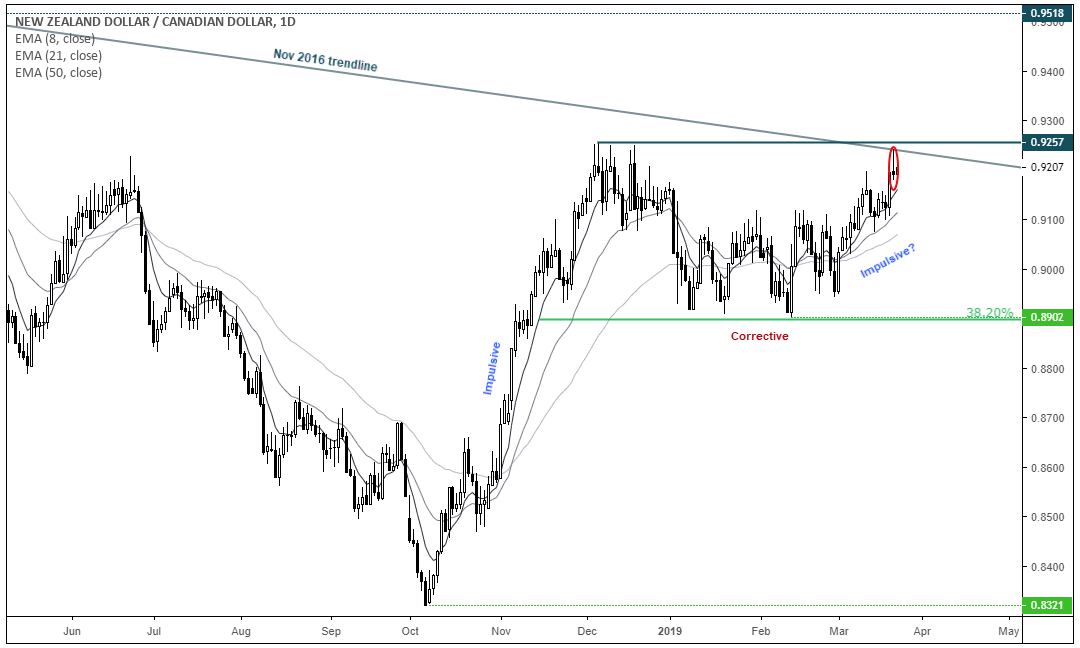
A bearish pinbar shows a hesitancy to break higher, yet perhaps this could be expected given the importance of the trendline and the host of Canadian data released today. But, if the daily trend is to hold, a break above 0.9277 invalidates the bearish trendline and opens-up a run for 0.9581.

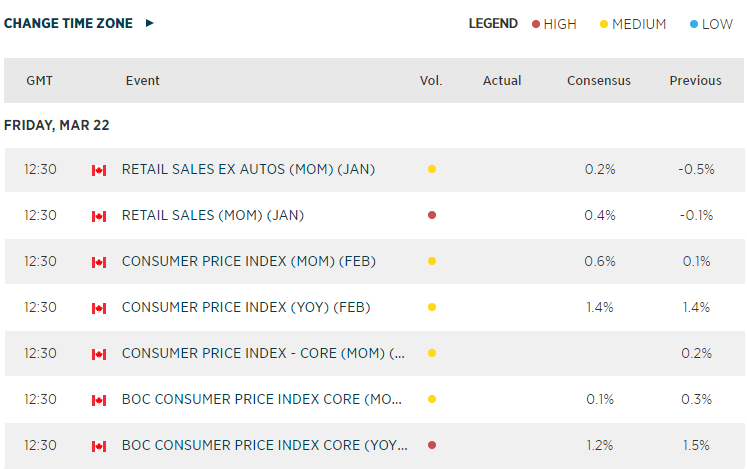
Keep in mind a host of Canadian data is released later today, and the BOC remain data dependant. Although BOC and RBNZ have their rates set at 1.75%, RBNZ is the more neutral bank of the two, meaning a strong or weak data set for Canada today could bring forward or push back expectations for their next hike, will dictate CAD’s direction. Therefor Canada’s data today could dictate which side of the trendline we close the week on, whilst could dictate sentiment as we head into next week.

CHART

Author

Matt Simpson, CFTe, MSTA

Matt Simpson is a certified technical analyst who combines charts and fundamentals to generate trading themes.

More from Matt Simpson, CFTe, MSTA
Share:

Editor's Picks

EUR/USD keeps the rangebound trade near 1.1850

EUR/USD is still under pressure, drifting back towards the 1.1850 area as Monday’s session draws to a close. The modest decline in spot comes as the US Dollar picks up a bit of support, while thin liquidity and muted volatility, thanks to the US market holiday, are exaggerating price swings and keeping trading conditions choppy.
 

GBP/USD flirts with daily lows near 1.3630

GBP/USD has quickly given back Friday’s solid gains, turning lower at the start of the week and drifting back towards the 1.3630 area. The focus now shifts squarely to Tuesday’s UK labour market report, which is likely to keep the quid firmly in the spotlight and could set the tone for Cable’s next move.

Gold sticks to a negative bias below $5,000; lacks bearish conviction

Gold remains depressed for the second consecutive day and trades below the $5,000 psychological mark during the Asian session on Tuesday, as a positive risk tone is seen undermining safe-haven assets. Meanwhile, bets for more interest rate cuts by the Fed keep a lid on the recent US Dollar bounce and act as a tailwind for the non-yielding bullion, warranting caution for bearish traders ahead of FOMC minutes on Wednesday.

AI Crypto Update: Bittensor eyes breakout as AI tokens falter 

The artificial intelligence (AI) cryptocurrency segment is witnessing heightened volatility, with top tokens such as Near Protocol (NEAR) struggling to gain traction amid the persistent decline in January and February.

US CPI is cooling but what about inflation?

The January CPI data give the impression that the Federal Reserve is finally winning the war against inflation. Not only was the data cooler than expected, but it’s also beginning to edge close to the mystical 2 percent target. CBS News called it “the best inflation news we've had in months.”

XRP steadies in narrow range as fund inflows, futures interest rise

Ripple is trading in a narrow range between $1.45 (immediate support) and $1.50 (resistance) at the time of writing on Monday. The remittance token extended its recovery last week, peaking at $1.67 on Sunday from the weekly open at $1.43.