Nvidia beat expectations – But why is the stock dropping? Time to buy the dip?

Feeling confused about Nvidia’s stock drop despite their stellar earnings report?
You’re not alone.
Market sentiment doesn’t align with financial performance.
In this guide, we’ll dive into how you can decode market behavior using Repeat Energy Patterns, based on the principles of W.D. Gann, to better predict stock trends and make informed decisions.
What you will learn:
How to identify and use Repeat Energy Patterns in trading
Steps to analyze Nvidia’s current trading chart
Repeat Energy Patterns: A Guide for Your Trading Decisions
Now, let’s talk about strategies.
What are repeat Energy patterns?
Repeat Energy Patterns come from WD Gann’s Stock & Commodities Course methods.
These patterns help us see trends and trading opportunities before other Technical Indicators and Patterns, such as Gartley or Butterfly.
Look for repeat patterns
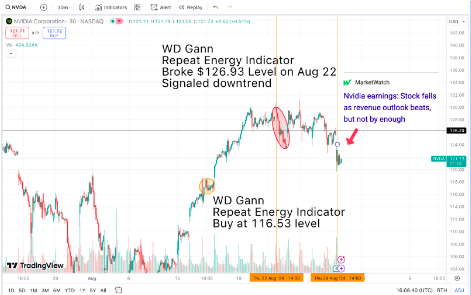
In mid-August, the WD Gann Repeat Energy Indicator signaled a buy for Nvidia at $116.53.
Guess what happened next?
The price rallied up to the $129 level.
August 22: A turning point
On August 22, the indicator signaled a downtrend as the price broke at $126.93. This signaled a trend change as the price dips below the Repeat Energy Pattern. Take profit and exit the trade.
By August 27, I had made a live call to short-sell Nvidia BEFORE the earnings report on August 29.
What happened next?
Nvidia's stock fell even though revenue beat expectations. But the news wasn't enough to push the price up again.
Action plan
1. Use the WD Gann indicator.
On August 27, based on the downtrend signal, I recommended short-selling Nvidia. This wasn't a guess; it was based on the patterns we’ve been discussing.
2. Identify the repeat Energy pattern.
Examining the Stock Chart helps you see Repeat Patterns and price levels. Watch the market closely, and look for Repeat Energy Patterns to see if a change of trend, buy or sell opportunity.
Final words
The repeat Energy patterns indicate an implicit rule of the trend that drives the market. The market consistently makes lower lows, confirming the downward movement and leading to a drop in the stock price.
This trading method provides a framework for understanding market movements at the moment, not after the fact.
Remember, the key to trading is continuous learning and adapting. So keep honing your skills, stay informed, and don't fear taking calculated risks.
Happy trading!
Author

Khit Wong
Gann Explained
As a noted expert on FXStreet.com and in “Technical Analysis of Stocks & Commodities” and "Traders World," I specialize in applying W.D. Gann's complex theories to practical trading.


