No News is not Good News [Video]
![No News is not Good News [Video]](https://editorial.fxstreet.com/images/Markets/Commodities/Metals/Gold/gold-gm187363896-28836378_XtraLarge.jpg)
US Dollar: Dec USD is Down at 97.565.
Energies: Jan'20 Crude is Down at 58.82.
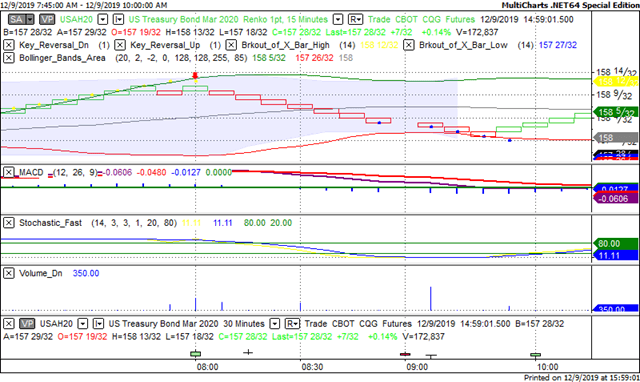
Financials: The Mar'20 30 year bond is Up 11 ticks and trading at 158.10.
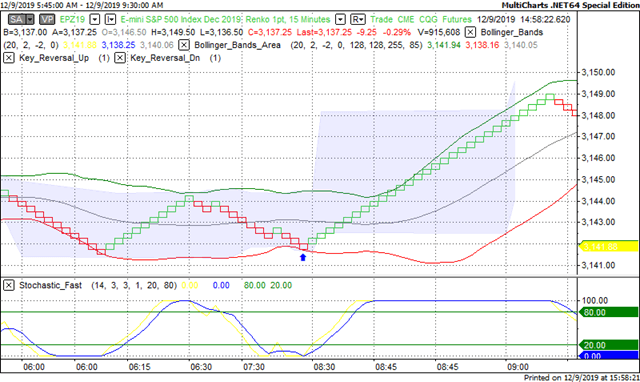
Indices: The Dec S&P 500 emini ES contract is 44 ticks Lower and trading at 3125.00.
Gold: The Feb'20 Gold contract is trading Up at 1468.70. Gold is 38 ticks Higher than its close.
Initial Conclusion
This is not a correlated market. The dollar is Down- and Crude is Down- which is not normal and the 30 year Bond is trading Higher. The Financials should always correlate with the US dollar such that if the dollar is lower then bonds should follow and vice-versa. The S&P is Lower and Crude is trading Lower which is not correlated. Gold is trading Higher which is correlated with the US dollar trading Down. I tend to believe that Gold has an inverse relationship with the US Dollar as when the US Dollar is down, Gold tends to rise in value and vice-versa. Think of it as a seesaw, when one is up the other should be down. I point this out to you to make you aware that when we don't have a correlated market, it means something is wrong. As traders you need to be aware of this and proceed with your eyes wide open.
At this time Asia is trading mainly Lower with the exception of the Shanghai exchange which is fractionally Lower at this time. Currently all of Europe is trading Lower.
Possible Challenges To Traders Today:
-
NFIB Small Business Index is out at 6 AM EST. This is Major.
-
Revised Nonfarm Productivity is out at 8:30 AM EST. This is Major.
-
Revised Unit Labor Costs is out at 8:30 AM EST. This is Major.
-
10-y Bond Auction is out at 1 PM EST. This is Major.
Treasuries
We've elected to switch gears a bit and show correlation between the 30 year bond (ZB) and The S&P futures contract. The S&P contract is the Standard and Poor's and the purpose is to show reverse correlation between the two instruments. Remember it's liken to a seesaw, when up goes up the other should go down and vice versa.
Yesterday the ZB made a major move at around 8 AM EST. The ZB hit a High at around that time and the S&P moved Higher. If you look at the charts below ZB gave a signal at around 8 AM EST and the S&P moved Higher at the same time. Look at the charts below and you'll see a pattern for both assets. ZB hit a High at around 8 AM and the S&P was moving Higher shortly thereafter. These charts represent the newest version of MultiCharts and I've changed the timeframe to a 15 minute chart to display better. This represented a Shorting opportunity on the 30 year bond, as a trader you could have netted about a dozen ticks per contract on this trade. Each tick is worth $31.25. Please note: the front month for the ZB is now March '20. The S&P contract is still December. I've changed the format to Renko bars such that it may be more apparent and visible.
Charts Courtesy of MultiCharts built on an AMP platform
Bias
Yesterday we gave the markets a Neutral bias as we didn't see much in the way of correlation. The Dow dropped 105 points and the other indices lost ground as well. Today we aren't dealing with a correlated market and our bias is Neutral.
Could this change? Of Course. Remember anything can happen in a volatile market.
Commentary
Yesterday was the first trading day after Jobs Friday and what did we see? The Dow dropped over 100 points with no economic to speak of and the other indices dropped as well. Coincidentally yesterday also marked the return of the Impeachers and it would appear as though the House of Representatives will move forward with the Impeachment of President Trump. However all of this is meaningless unless it can pass muster in the Senate and based upon what was witnessed in the House it will come down to a party line. The GOP does hold a majority in the Senate, so time will tell how it all works out...
Author

Nick Mastrandrea
Market Tea Leaves


