No news is no good news

USD: Jun '23 is Up at 103.475.
Energies: Jul '23 Crude is Up at 72.10.
Financials: The Jun '23 30 Year T-Bond is Down 14 ticks and trading at 126.11.
Indices: The Jun '23 S&P 500 emini ES contract is 15 ticks Lower and trading at 4201.25.
Gold: The Jun'23 Gold contract is trading Down at 1956.60. Gold is 206 ticks Lower than its close.
Initial conclusion
This is not a correlated market. The USD is Up, Crude is Up which is not normal, but the 30 Year T-Bond is trading Lower. The Financials should always correlate with the US dollar such that if the dollar is Higher, then the bonds should follow and vice-versa. The S&P is Lower, and Crude is trading Higher which is correlated. Gold is trading Lower which is correlated with the US dollar trading Up. I tend to believe that Gold has an inverse relationship with the US Dollar as when the US Dollar is down, Gold tends to rise in value and vice-versa. Think of it as a seesaw, when one is up the other should be down. I point this out to you to make you aware that when we don't have a correlated market, it means something is wrong. As traders you need to be aware of this and proceed with your eyes wide open. At the present time Asia is trading mainly Lower with the exception of the Sensex and Singapore exchanges. Europe is trading Lower with the exception of the London exchange which is Higher at this time.
Possible challenges to traders today
-
FOMC Member Logan Speaks at 9 AM EST. This is Major.
-
Flash Manufacturing PMI is out at 9:45 AM EST. This is Major.
-
Flash Services PMI is out at 9:45 AM EST. This is Major.
-
New Home Sales is out at 10 AM EST. This is Major.
-
Richmond Manufacturing Index is out at 10 AM EST. This is Major.
Treasuries
Traders, please note that we've changed the Bond instrument from the 30 year (ZB) to the 10 year (ZN). They work exactly the same.
We've elected to switch gears a bit and show correlation between the 10-year bond (ZN) and the S&P futures contract. The S&P contract is the Standard and Poor's, and the purpose is to show reverse correlation between the two instruments. Remember it's likened to a seesaw, when up goes up the other should go down and vice versa.
Yesterday the ZN migrated Lower at around 9:15 AM EST as the S&P hit a Low at around the same time. If you look at the charts below the ZN gave a signal at around 9:15 AM and the ZN continued its Downward trend. Look at the charts below and you'll see a pattern for both assets. S&P hit a Low at around 9:15 AM and migrated Higher. These charts represent the newest version of MultiCharts and I've changed the timeframe to a 15-minute chart to display better. This represented a Short opportunity on the 10-year note, as a trader you could have netted about a dozen ticks per contract on this trade. Each tick is worth $15.625. Please note: the front month for the ZN is now Jun '23. The S&P contract is also Jun' 23. I've changed the format to filled Candlesticks (not hollow) such that it may be more apparent and visible.
Charts courtesy of MultiCharts built on an AMP platform
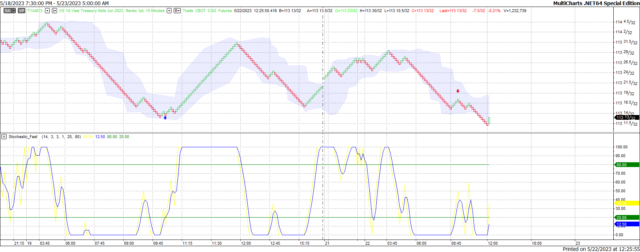
ZN - Jun 2023 - 5/22/23
-638204372959586069.png)
S&P - Jun 2023 - 5/22/23
Bias
Yesterday we gave the markets a Neutral or Mixed bias as we didn't see any semblance of market correlation Monday morning and the markets didn't disappoint. The Dow closed Lower by 140 points, but the S&P and Nasdaq managed to eke out a gain despite the Dow's actions. Today we aren't dealing with a correlated market and our bias is Neutral or Mixed.
Could this change? Of Course. Remember anything can happen in a volatile market.
Commentary
Yesterday we had no economic news for the US markets and as such the markets were left to their own devices. When that situation occurs other factors take hold. In other words, perception becomes reality. So, what's driving the markets now? Well, the Debt Ceiling business isn't helping. Retirees are wondering "will I get my Social Security next month or will my payment be cut"? Again, perception becomes reality. Today we have far more economic news than yesterday. New Home Sales and Richmond Manufacturing Index are major and proven market movers. Will this be enough to propel the markets forward. As in all things, only time will tell.
Author

Nick Mastrandrea
Market Tea Leaves


