No Clear Direction As Stocks Trade Along Record Highs

Our intraday outlook is bearish, and our short-term outlook is bearish, as we expect downward correction. Our medium-term outlook remains neutral:
Intraday outlook (next 24 hours): bearish
Short-term outlook (next 1-2 weeks): bearish
Medium-term outlook (next 1-3 months): neutral
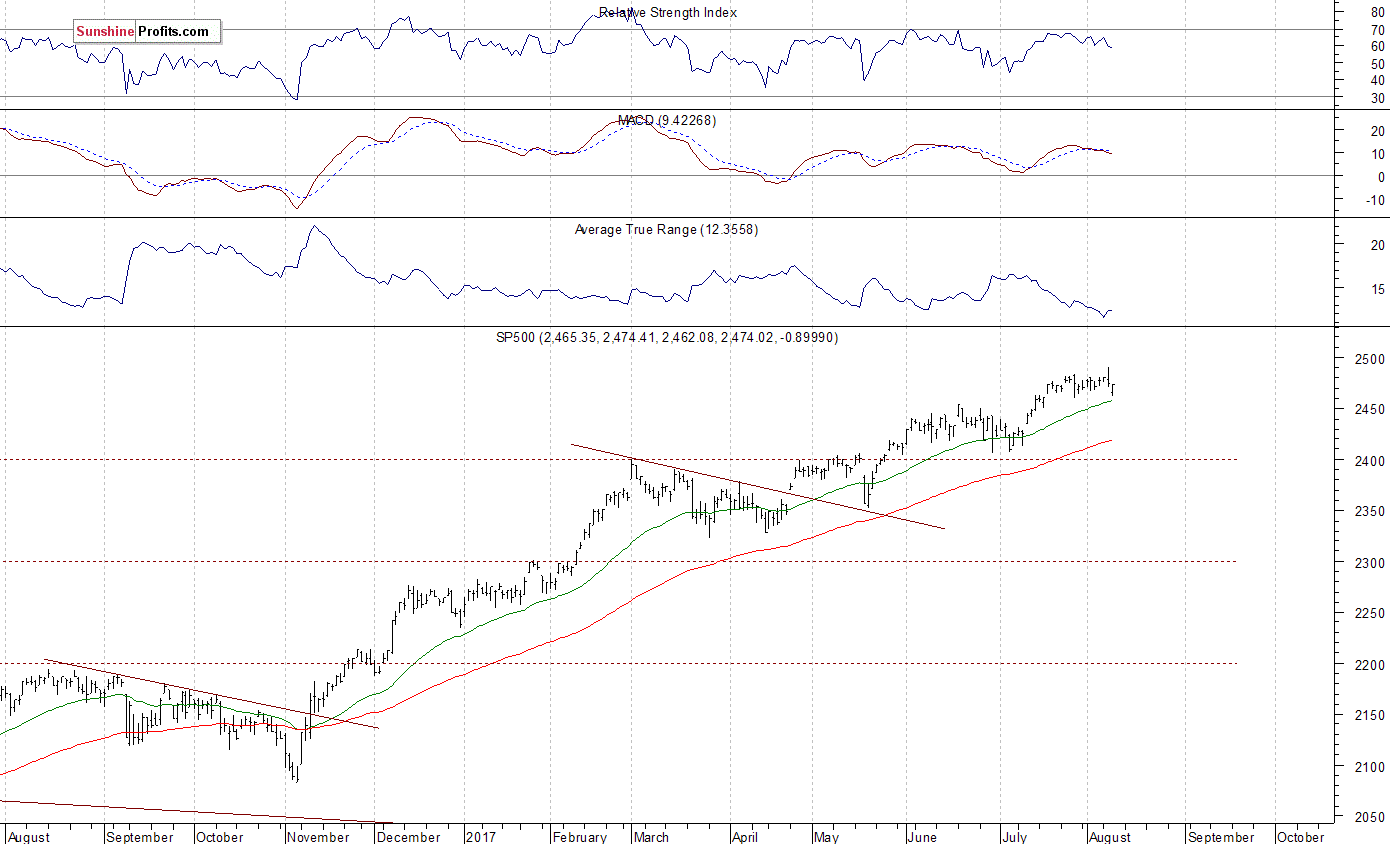
The U.S. stock market indexes were mixed between -0.3% and 0.0% on Wednesday, extending their short-term fluctuations, as investors continued to take profits off the table following some negative geopolitical news, among others. The S&P 500 index has reached new all-time high at the level of 2,490.87 on Tuesday, before reversing lower. The broad stock market gauge bounced off resistance level at around 2,490-2,500. The Dow Jones Industrial Average lost 0.2% yesterday, as it extended its Tuesday's move down off new record high. The technology Nasdaq Composite lost 0.3%, as it was relatively weaker than the broad stock market again. The nearest important support level of the S&P 500 index remains at 2,460-2,465, marked by July 19 daily gap up of 2,460.92-2,463.85 along with yesterday's daily low of 2,462.08. The next level of support is at 2,450-2,455, marked by June 19 local high. The support level is also at 2,430-2,435, marked by July 12 daily gap up of 2,429.30-2,435.75. On the other hand, level of resistance is at 2,485-2,490, marked by all-time high along with previous local high. The next resistance level is at 2,500 mark. There have been no confirmed negative signals so far. However, we can see medium-term overbought conditions and negative technical divergences. The S&P 500 index trades within an almost month-long consolidation, as we can see on the daily chart:
Futures Lower
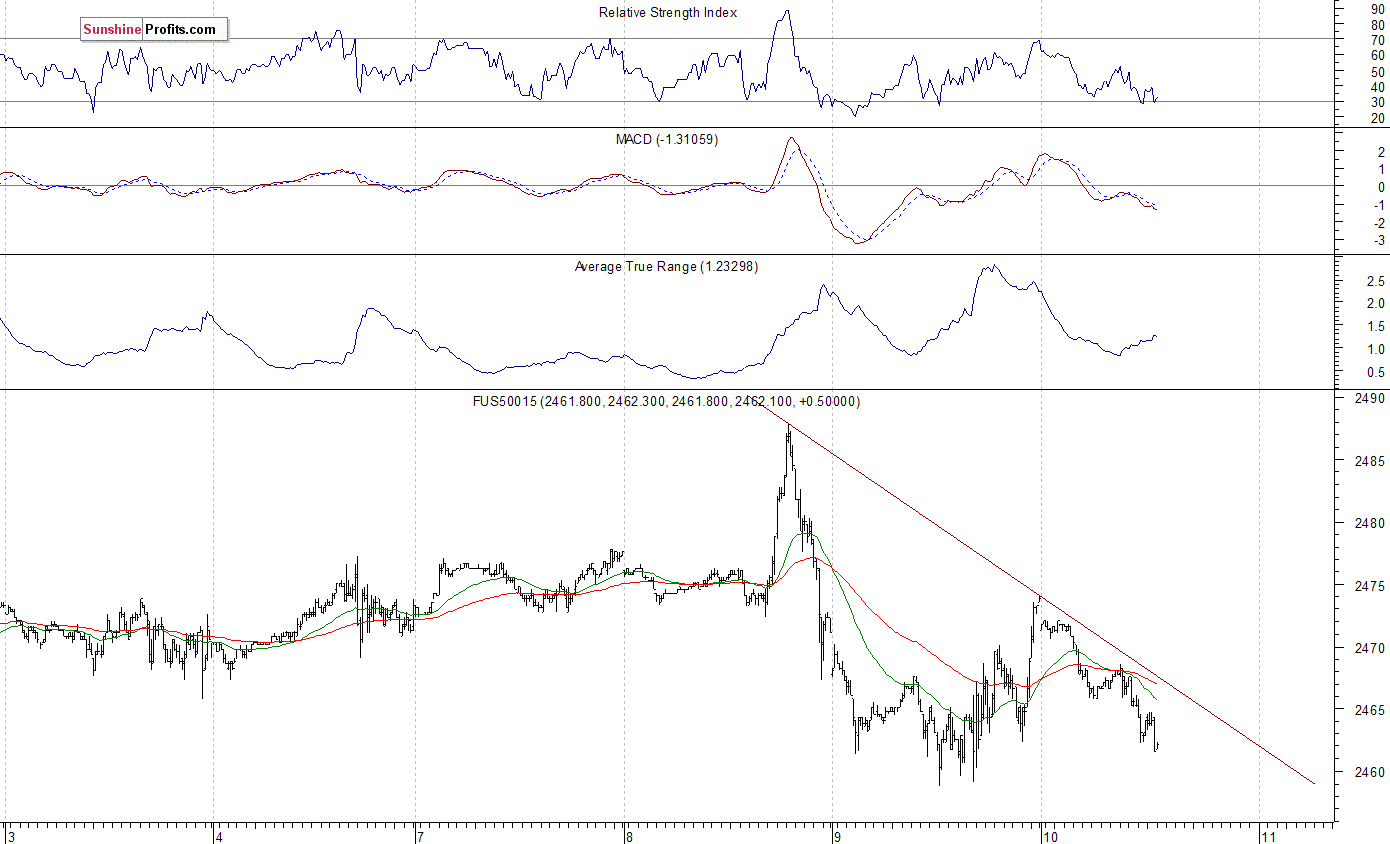
Expectations before the opening of today's trading session are negative, with index futures currently down between 0.2% and 0.6% vs. their Wednesday's closing prices. The European stock market indexes have lost 0.4-1.2% so far. Investors will now wait for some economic data announcements: Producer Price Index, Initial Claims at 8:30 a.m. The market expects that Producer Price Index grew 0.1% in July, and Initial Claims were at 240,000 last week. The S&P 500 futures contract trades within an intraday downtrend, as it retraces yesterday's intraday move up. The market trades within a short-term consolidation following Tuesday's intraday reversal. The nearest important level of resistance is at around 2,470-2,475, marked by local high. The next resistance level remains at 2,480-2,490, marked by record high. On the other hand, support level is at 2,460, marked by short-term local low. The next support level remains at 2,450, among others. Will the market break below this short-term consolidation? It is currently trading close to lower consolidation band:
Nasdaq Still Weaker
The technology Nasdaq 100 futures contract follows a similar path, as it retraces some of yesterday's intraday rebound off support level at around 5,860. The market remains within a few-week-long trading range along new record high, slightly below the level of 6,000. The nearest important level of resistance is at around 5,920-5,930, marked by short-term local highs. The next resistance level remains at 5,950-6,000. On the other hand, support level is at 5,850-5,870, marked by short-term local lows, as the 15-minute chart shows:

Concluding, the S&P 500 index continued to fluctuate on Wednesday, as it retraced some of Tuesday's decline. Is this a short-term bottom or just pause before another leg down? The index extends its almost month-long consolidation following early July move up. Is this just flat correction before another leg up or some medium-term topping pattern? There have been no confirmed medium-term negative signals so far. However, the market remains technically overbought. We can also see some negative technical divergences.
Want free follow-ups to the above article and details not available to 99%+ investors? Sign up to our free newsletter today!
Author

Paul Rejczak
Sunshine Profits
Paul Rejczak is a stock market strategist who has been known for the quality of his technical and fundamental analysis since the late nineties.


