Nikkei 225 Hits the 24,000 Points
The Japanese Nikkei 225 index rises on Friday fueled by the animating sentiment of merchants following the "phase one" trade agreement between the United States and China.
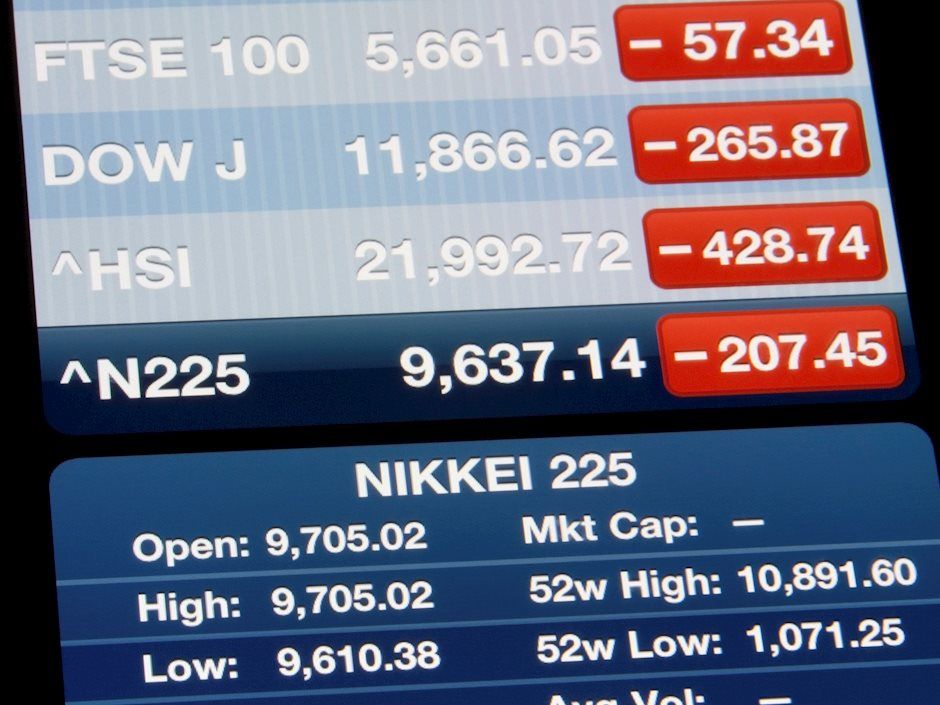
Nikkei 225 climbs 250 points or 1.05%, reaching 24,000 points, the Hang Seng shoots 553.3 points or 2.05%, reaching 27,546.52 points, The Australian index ASX 200 grows 19.2 points or 0.29% reaching 6,738.7 points.
On Thursday 12, the representatives of the two largest economies of the world's largest economies signed the Phase 1 trade agreement ending a series of trade tensions.
After the signing of the agreement, markets became more optimistic and American indices closed at record highs.
Technical Overview
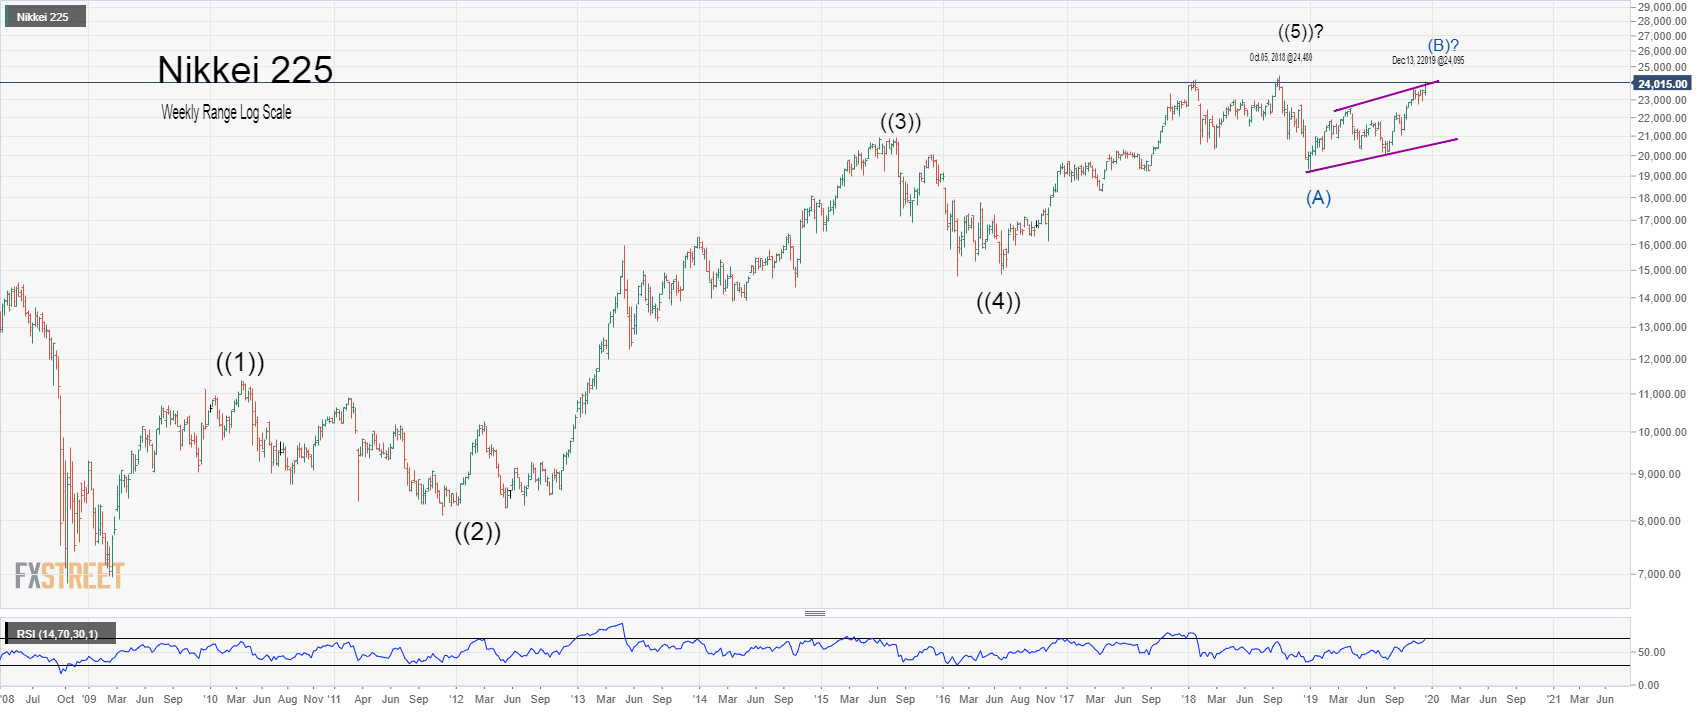
Nikkei, in its weekly chart, shows the advance of the price, reaching the maximum levels of 2018, which reached 24,480 points. However, in terms of Elliott's wave theory, we can see that the price action could have completed a five-wave upward impulsive sequence and are currently beginning to develop a downward corrective movement.
The following graph shows the Japanese index in daily temporality, where we see the action of the price developing an upward movement that is approaching the high recorded in early of October 2018.
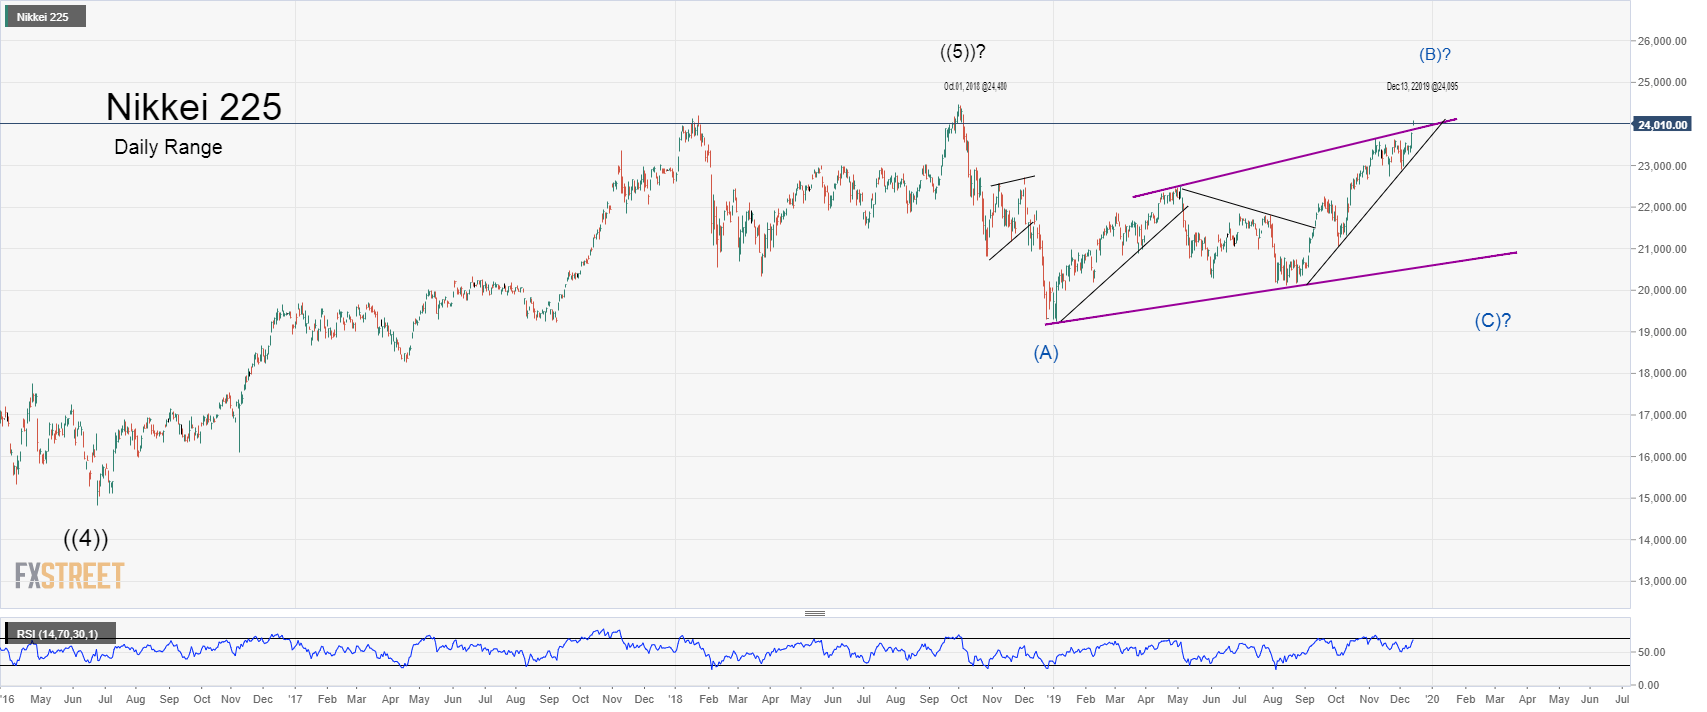
On the other hand, we see that from the peak reached in 2018, the corrective movement of the bass developed in three waves as a wave (A) labeled in blue. Subsequently, once Nikkei 225 found buyers, the Japanese index began to create an upward sequence of three internal segments as an expansive triangle.
According to the structure observed and following the principles of the Elliott Waves Theory, the formation that is developing the Nikkei 225 index would correspond to a Flat pattern. Remember that this structure characterizes by having an internal sequence as 3-3-5.
Consequently, if the structure being developed by Nikkei 225 corresponds to a flat pattern, the price action is running in a wave (B) labeled in blue. Once completed, the index should begin a bearish wave (C) of the same degree.
Author

EagleFX Team
EagleFX
EagleFX Team is an international group of market analysts with skills in fundamental and technical analysis, applying several methods to assess the state and likelihood of price movements on Forex, Commodities, Indices, Metals and


