News tsunami doesn't derail Dow

USD: Sep '26 is Down at 100.995.
Energies: Aug '26 Crude is Down at 69.11.
Financials: The Sep '26 30 Year T-Bond is Lower by 2 ticks and trading at 114.02.
Indices: The Jun '26 S&P 500 emini ES contract is 160 ticks Lower and trading at 7383.00.
Gold: The Aug'26 Gold contract is trading Up at 4065.60.
Initial conclusion
This is not a correlated market. The USD is Down and Crude is Down which is not normal, and the 30-Year T-Bond is trading Lower. The Financials should always correlate with the US dollar such that if the dollar is Higher, then the bonds should follow and vice-versa. The S&P is Lower and Crude is trading Lower which is not correlated. Gold is trading Lower which is not correlated with the US dollar trading Down. I tend to believe that Gold has an inverse relationship with the US Dollar as when the US Dollar is down, Gold tends to rise in value and vice-versa. Think of it as a seesaw, when one goes Up the other goes Down. Asia traded Lower with the exception of the Sensex exchange, all of Europe is trading Lower.
Possible challenges to traders
- Goods Trade Balance is out at 8:30 AM EST. Major.
- Prelim Wholesale Inventory is out at 8:30 AM EST. Major.
- Revised UOM Consumer Sentiment is out at 10 AM EST. Not Major.
- Revised UOM Inflation Expectation is out at 10 AM EST. Not Major.
- FOMC Member Kashkari Speaks at 11:40 AM EST. Major.
Traders, please note that we've changed the Bond instrument from the 10 Year (ZN) to the 2 Year (ZT). They work exactly the same.
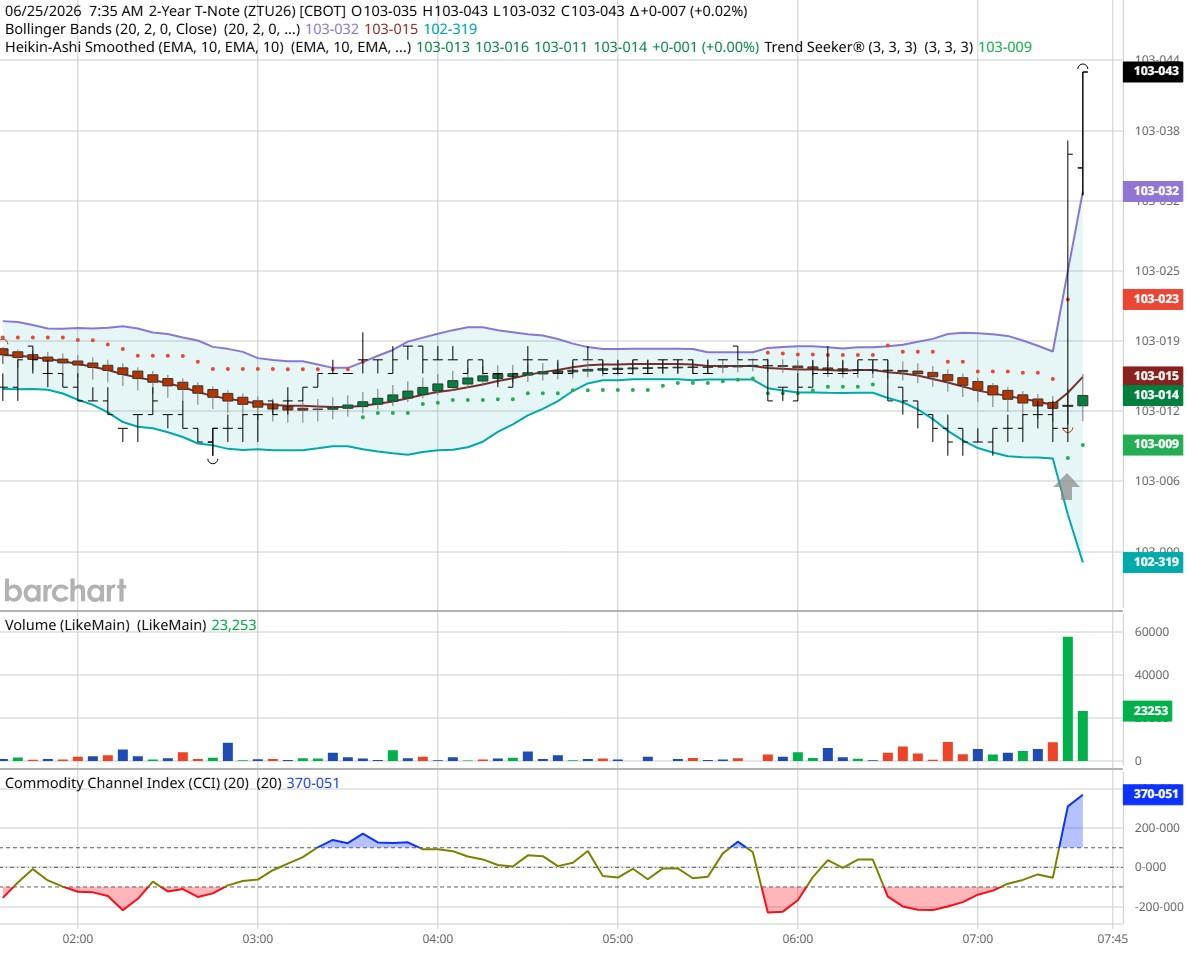
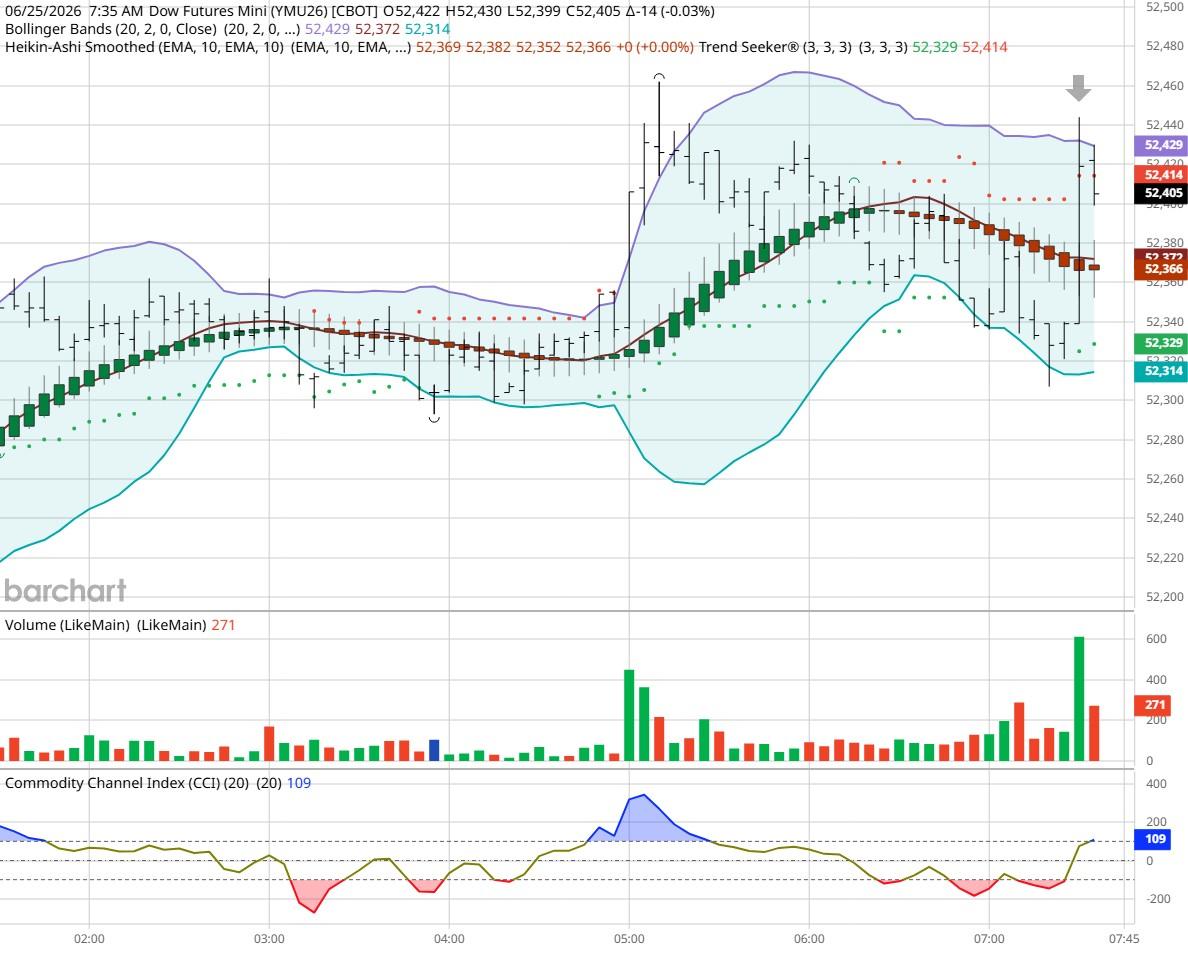
We've elected to switch gears a bit and show correlation between the 2-year Treasury notes (ZT) and the S&P futures contract. The YM contract is the Dow Jones Industrial Average, and the purpose is to show reverse correlation between the two instruments. Remember it's likened to a seesaw, when up goes up the other should go down and vice versa.
Yesterday the ZT climbed Higher at around 8:30 AM EST after the news items were released. The Dow dived Lower at around the same time. Look at the charts below and you'll see a pattern for both assets. The ZT climbed Higher at around 10 AM EST and the Dow dived Lower around the same time. These charts represent the newest version of Bar Charts, and I've changed the timeframe to a 15-minute chart to display better. This represented a Long opportunity on the 2-year note, as a trader you could have netted about 20 plus ticks per contract on this trade. Each tick is worth $6.25. Please note: the front month for the ZT is now Sep '26. I've changed the format to filled Candlesticks (not hollow) such that it may be more apparent and visible.
Charts courtesy of barcharts
Bias
Yesterday we gave the markets an Upside bias and the Dow was Higher. Dow closed 95 points Higher however the other indices closed Lower. Today our bias is Neutral or Mixed.
Could this change? Of Course. Remember anything can happen in a volatile market.
Commentary
The markets as of late are very confused between the situation is Iran and the affordability concerns. Each trading day will be different as the markets rise and fall.
Author

Nick Mastrandrea
Market Tea Leaves
Nick Mastrandrea over 20 years experience in trading and formerly held a NASD Series 7. He currently holds a NJ Life, Health and Variable Authority. Nick is a published writer and his work has appeared in Futures Magazine, TraderPlanet and others.