Stocks: Negative Expectations Following Last Week's Rally - Downward Reversal Or Just Correction?
Briefly: In our opinion, speculative short positions are favored (with stop-loss at 2,330, and profit target at 2,150, S&P 500 index).
Our intraday outlook remains bearish, and our short-term outlook is bearish. Our medium-term outlook remains neutral, following S&P 500 index breakout above last year's all-time high:
Intraday outlook (next 24 hours): bearish Short-term outlook (next 1-2 weeks): bearish Medium-term outlook (next 1-3 months): neutral Long-term outlook (next year): neutral
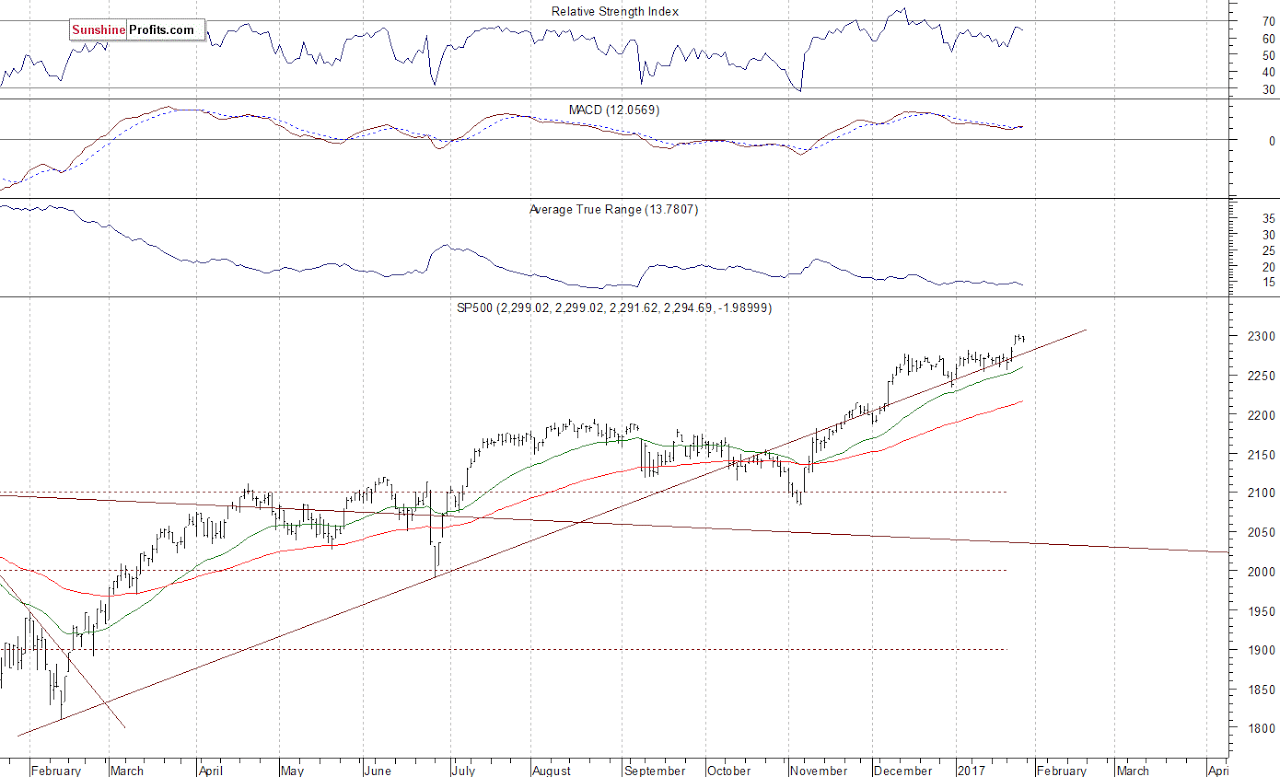
The U.S. stock market indexes were mixed between -0.1% and +0.2%, extending their short-term fluctuations along new record highs, as investors reacted to quarterly corporate earnings, economic data releases, among others. The S&P 500 index has reached new all-time high of 2.300.99 on Thursday. It continued to fluctuate close to 2,300 mark on Friday. The Dow Jones Industrial Average remains above the level of 20,000, following its Wednesday's breakout. The technology Nasdaq Composite Index continues to fluctuate above the level of 5,600, as it remains relatively stronger than the broad stock market. Will the market extend its year-long medium-term uptrend even further before some more meaningful downward correction? The nearest important resistance level of the S&P 500 index remains at 2,300 mark. On the other hand, the nearest support level is at around 2,285-2,290, marked by Wednesday's daily gap up of 2,284.63-2,288.88. The next support level is at 2,255-2,260, marked by recent local lows. We can see new long-term highs within almost eight-year-long bull market from 2009 multi-year low of 666.8. Is this some kind of a topping pattern before downward reversal? The S&P 500 index still trades along medium-term upward trend line, as we can see on the daily chart:
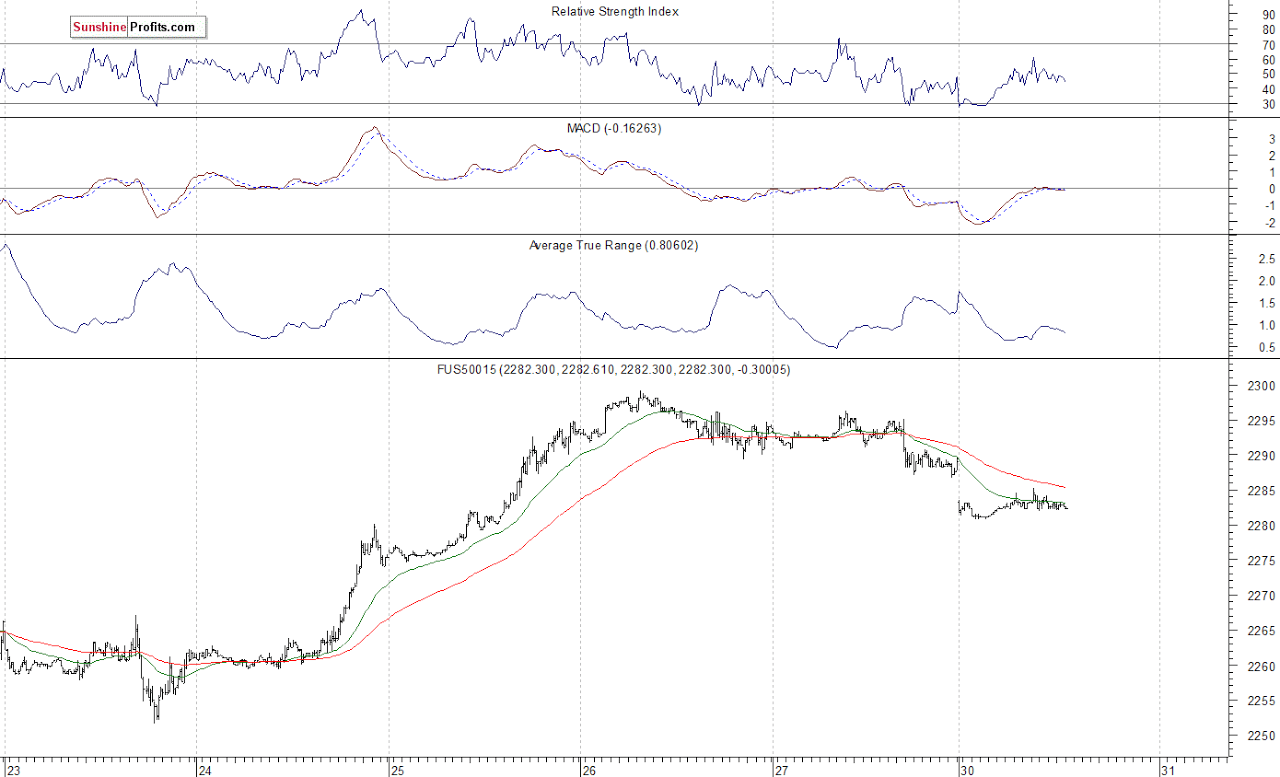
Expectations before the opening of today's trading session are negative, with index futures currently down 0.2-0.3%, as investors take short-term profits off the table following some political news releases, among others. The European stock market indexes have lost 0.7-0.9% so far. Investors will wait for more quarterly corporate earnings releases. They will also wait for some economic data announcements today: Personal Income, Personal Spending, PCE Prices - Core at 8:30 a.m., Pending Home Sales at 10:00 a.m. The market expects that Personal Spending along with Personal Spending grew 0.4% in December. The S&P 500 futures contract trades within an intraday consolidation, following a gap down opening. The market is below its recent trading range. Is this jus t a downward correction before another leg higher or some more important downward reversal? For now, it looks like a correction. There have been no confirmed negative signals so far. The nearest important level of resistance is at around 2,285-2,290, marked by recent support level. The next resistance level is at 2,300 mark. On the other hand, support level is at 2,280, marked by local lows. The next support level is at around 2,270, marked by previous consolidation, among others. The futures contract trades within a relatively tight intraday trading range, as the 15-minute chart shows:
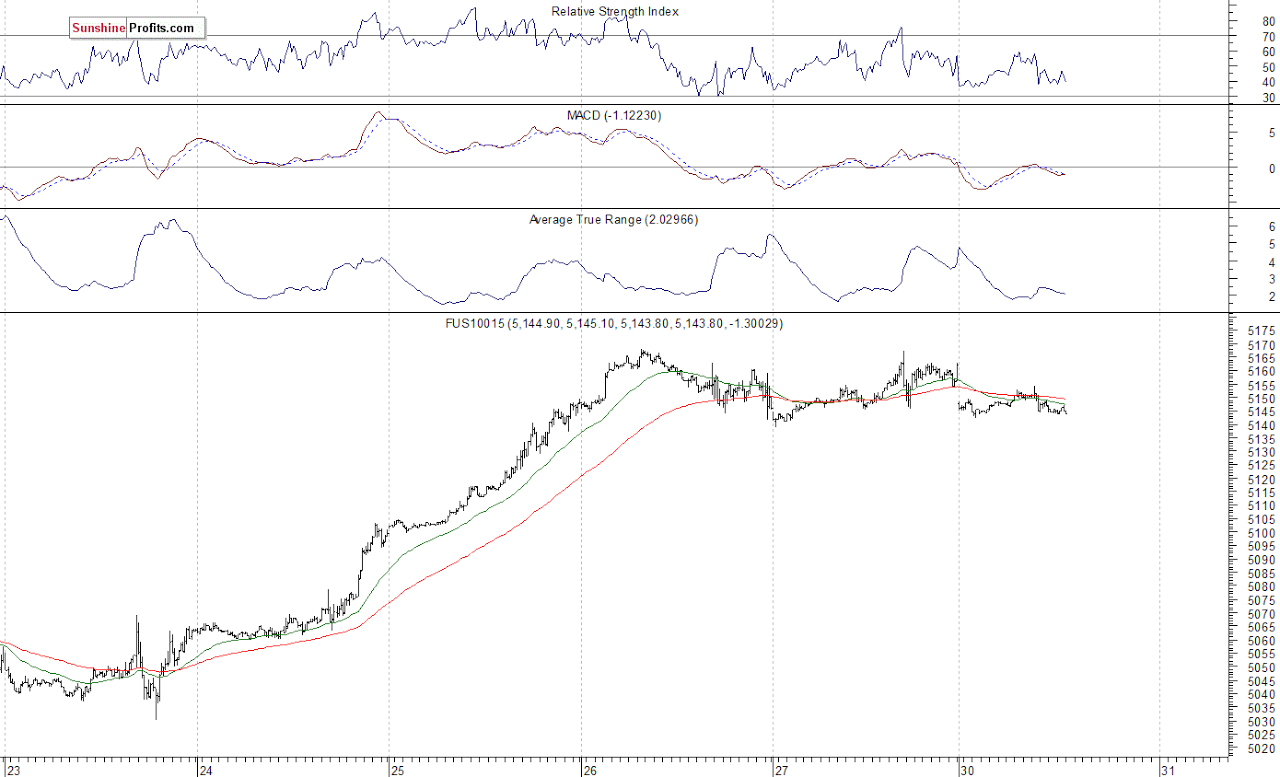
The technology Nasdaq 100 futures contract remains relatively stronger than the broad stock market indices, as it is still close to last week's new all-time high. The market trades slightly below 5,150 mark. The nearest important support level is at 5,130-5,150, marked by some short-term fluctuations. The next support level is at 5,100, marked by previous level of resistance. We still can see short-term technical overbought conditions. However, there have been no confirmed negative signals so far. Technology stocks have accelerated their medium-term uptrend recently:
Concluding, the broad stock market extended its short-term consolidation on Friday. The S&P 500 index traded along its Thursday's new record high. Expectations before the opening of today's trading session are negative, as investors' sentiment worsens. Is this just a quick downward correction or downward reversal? There have been no confirmed negative signals so far. However, we still can see medium-term overbought conditions accompanied by negative technical divergences. Therefore, we continue to maintain our speculative short position (opened on December 14 at 2,268.35 - daily opening price of the S&P 500 index). Stop-loss level remains at 2,330 and potential profit target is at 2,150 (S&P 500 index). You can trade S&P 500 index using futures contracts (S&P 500 futures contract - SP, E-mini S&P 500 futures contract - ES) or an ETF like the SPDR S&P 500 ETF - SPY. It is always important to set some exit price level in case some events cause the price to move in the unlikely direction. Having safety measures in place helps limit potential losses while letting the gains grow.
To summarize: short position in S&P 500 index is justified from the risk/reward perspective with the following entry prices, stop-loss orders and profit target price levels:
S&P 500 index - short position: profit target level: 2,150; stop-loss level: 2,330 S&P 500 futures contract (March 2017) - short position: profit target level: 2,145; stoploss level: 2,325 SPY ETF (SPDR S&P 500, not leveraged) - short position: profit target level: $214; stoploss level: $232 SDS ETF (ProShares UltraShort S&P500, leveraged: -2x) - long position: profit target level: $16.35; stop-loss level: $14.00 (calculated using trade's opening price on Dec 14 at $14.78).
Want free follow-ups to the above article and details not available to 99%+ investors? Sign up to our free newsletter today!
Author

Paul Rejczak
Sunshine Profits
Paul Rejczak is a stock market strategist who has been known for the quality of his technical and fundamental analysis since the late nineties.


