Navigating holiday trading and unpredictable trends

USD: Mar '25 is Down at 107.750.
Energies: Feb '25 Crude is Up at 70.26.
Financials: The Mar '25 30 Year T-Bond is Down 22 ticks and trading at 113.08.
Indices: The Mar '25 S&P 500 emini ES contract is 85 ticks Lower and trading at 6074.00.
Gold: The Feb'25 Gold contract is trading Down at 2643.50.
Initial conclusion
This is not a correlated market. The USD is Down and Crude is Up which is normal, and the 30 Year T-Bond is trading Lower. The Financials should always correlate with the US dollar such that if the dollar is Higher, then the bonds should follow and vice-versa. The S&P is Lower and Crude is trading Higher which is correlated. Gold is trading Lower which is not correlated with the US dollar trading Down. I tend to believe that Gold has an inverse relationship with the US Dollar as when the US Dollar is down, Gold tends to rise in value and vice-versa. Think of it as a seesaw, when one is up the other should be down. I point this out to you to make you aware that when we don't have a correlated market, it means something is wrong. As traders you need to be aware of this and proceed with your eyes wide open. Asia traded mainly Higher with the exception of the Hang Seng exchange. All of Europe is trading Higher.
Possible challenges to traders
-
Goods Trade Balance is out at 8:30 AM EST. This is Major.
-
Preliminary Wholesale Inventories is out at 8:30 AM EST. This is Major.
-
Natural Gas Storage is out at 10:30 AM EST. This is Major.
-
Crude Oil Inventories is out at 1 PM EST. This is Major.
Traders, please note that we've changed the Bond instrument from the 10 year (ZN) to the 2 year (ZT). They work exactly the same.
We've elected to switch gears a bit and show correlation between the 2-year Treasury notes (ZT) and the S&P futures contract. The YM contract is the Dow Jones Industrial Average, and the purpose is to show reverse correlation between the two instruments. Remember it's likened to a seesaw, when up goes up the other should go down and vice versa.
Yesterday the ZT migrated Higher at around 12 noon EST with no news in sight. The Dow dived Lower at the same time. Look at the charts below and you'll see a pattern for both assets. The Dow moved Lower at 12 noon EST and the ZT moved Higher at around the same time. These charts represent the newest version of Bar Charts, and I've changed the timeframe to a 15-minute chart to display better. This represented a Long opportunity on the 2-year note, as a trader you could have netted about 20 plus ticks per contract on this trade. Each tick is worth $7.625. Please note: the front month for ZT is now Mar '25 and the Dow is now Mar '25. I've changed the format to filled Candlesticks (not hollow) such that it may be more apparent and visible.
Charts courtesy of barcharts

ZT -Mar 2025 - 12/26/24
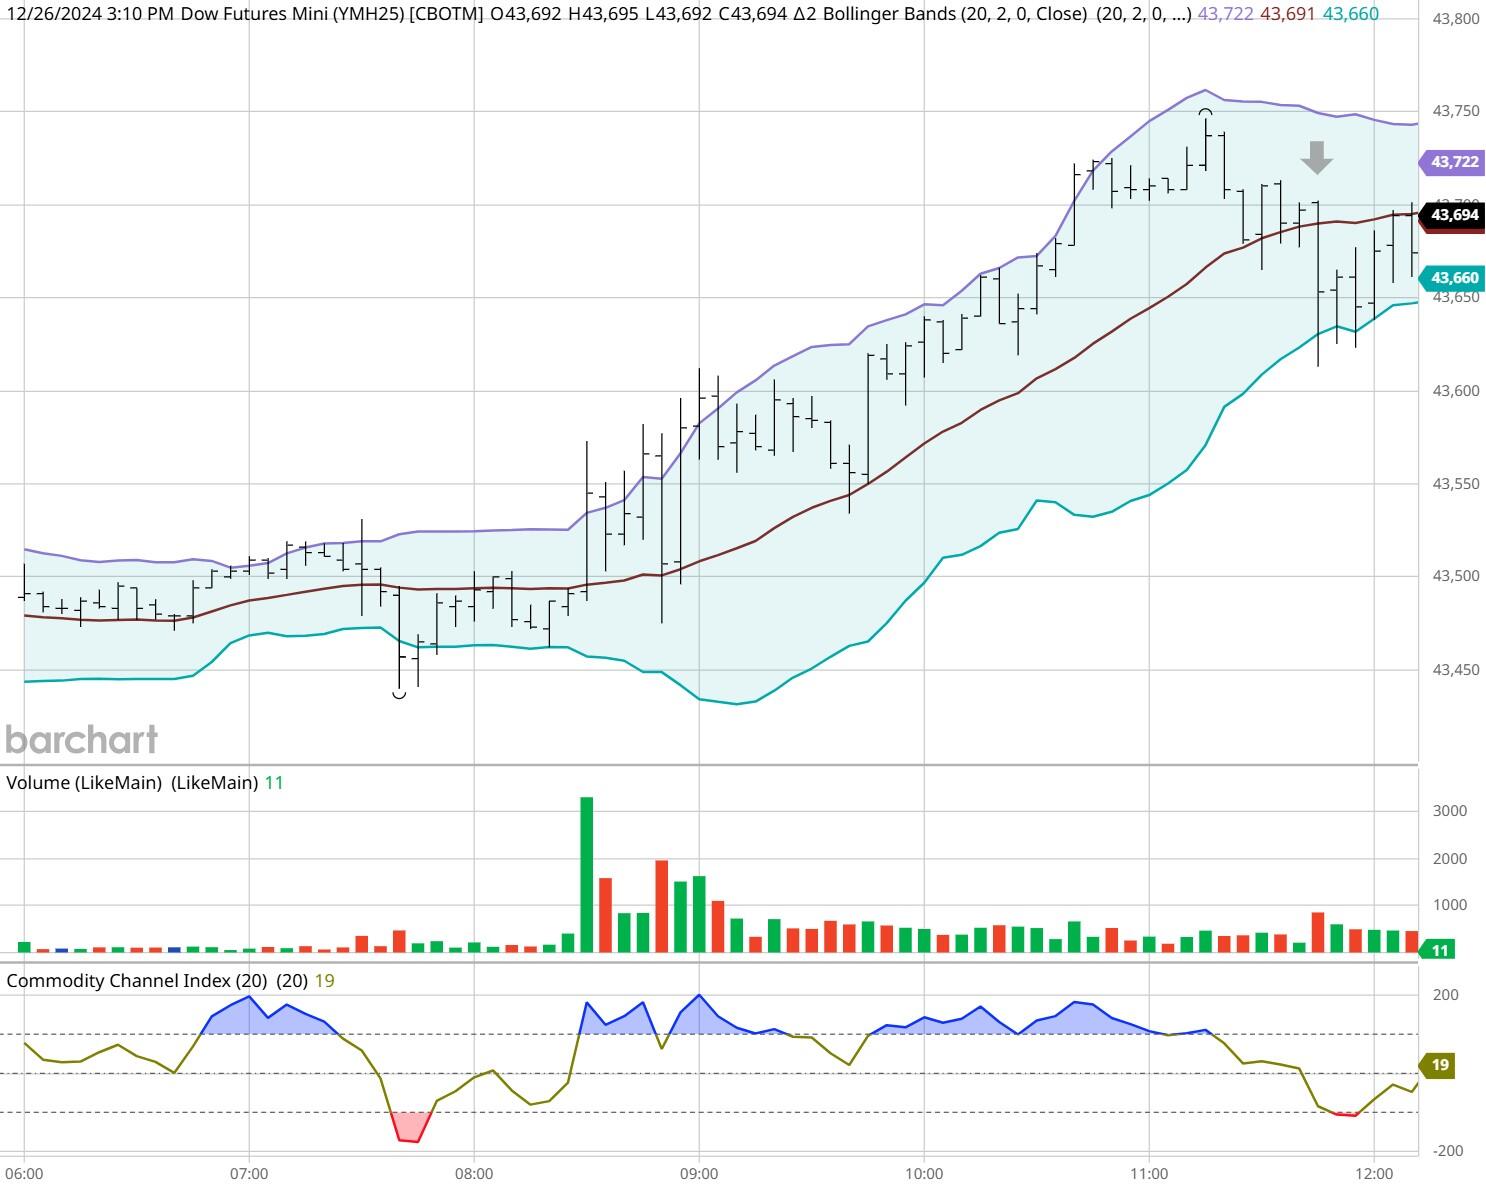
Dow - Mar 2025- 12/26/24
Bias
Yesterday we gave the markets a Neutral or Mixed bias and they didn't disappoint. The Dow closed Higher by 29 points, but the other indices closed Lower on the session. All in all, a Neutral or Mixed Day. Today we still aren't dealing with a correlated market, and our bias will remain Neutral or Mixed.
Could this change? Of Course. Remember anything can happen in a volatile market.
Commentary
As holiday trading will sometimes go on the days that you assume it will go Higher it doesn't. Very simply because the market wasn't correlated to go Higher on that day. Yesterday was one of those days. When we first looked at the markets yesterday morning one might assume that everything would go Lower, but it didn't. Today we have more news than yesterday, and it is our hope that this can steer the markets in a positive direction; but as in all things, only time will tell.
Author

Nick Mastrandrea
Market Tea Leaves


