|

Natural Gas (NG_F) continue to resume lower

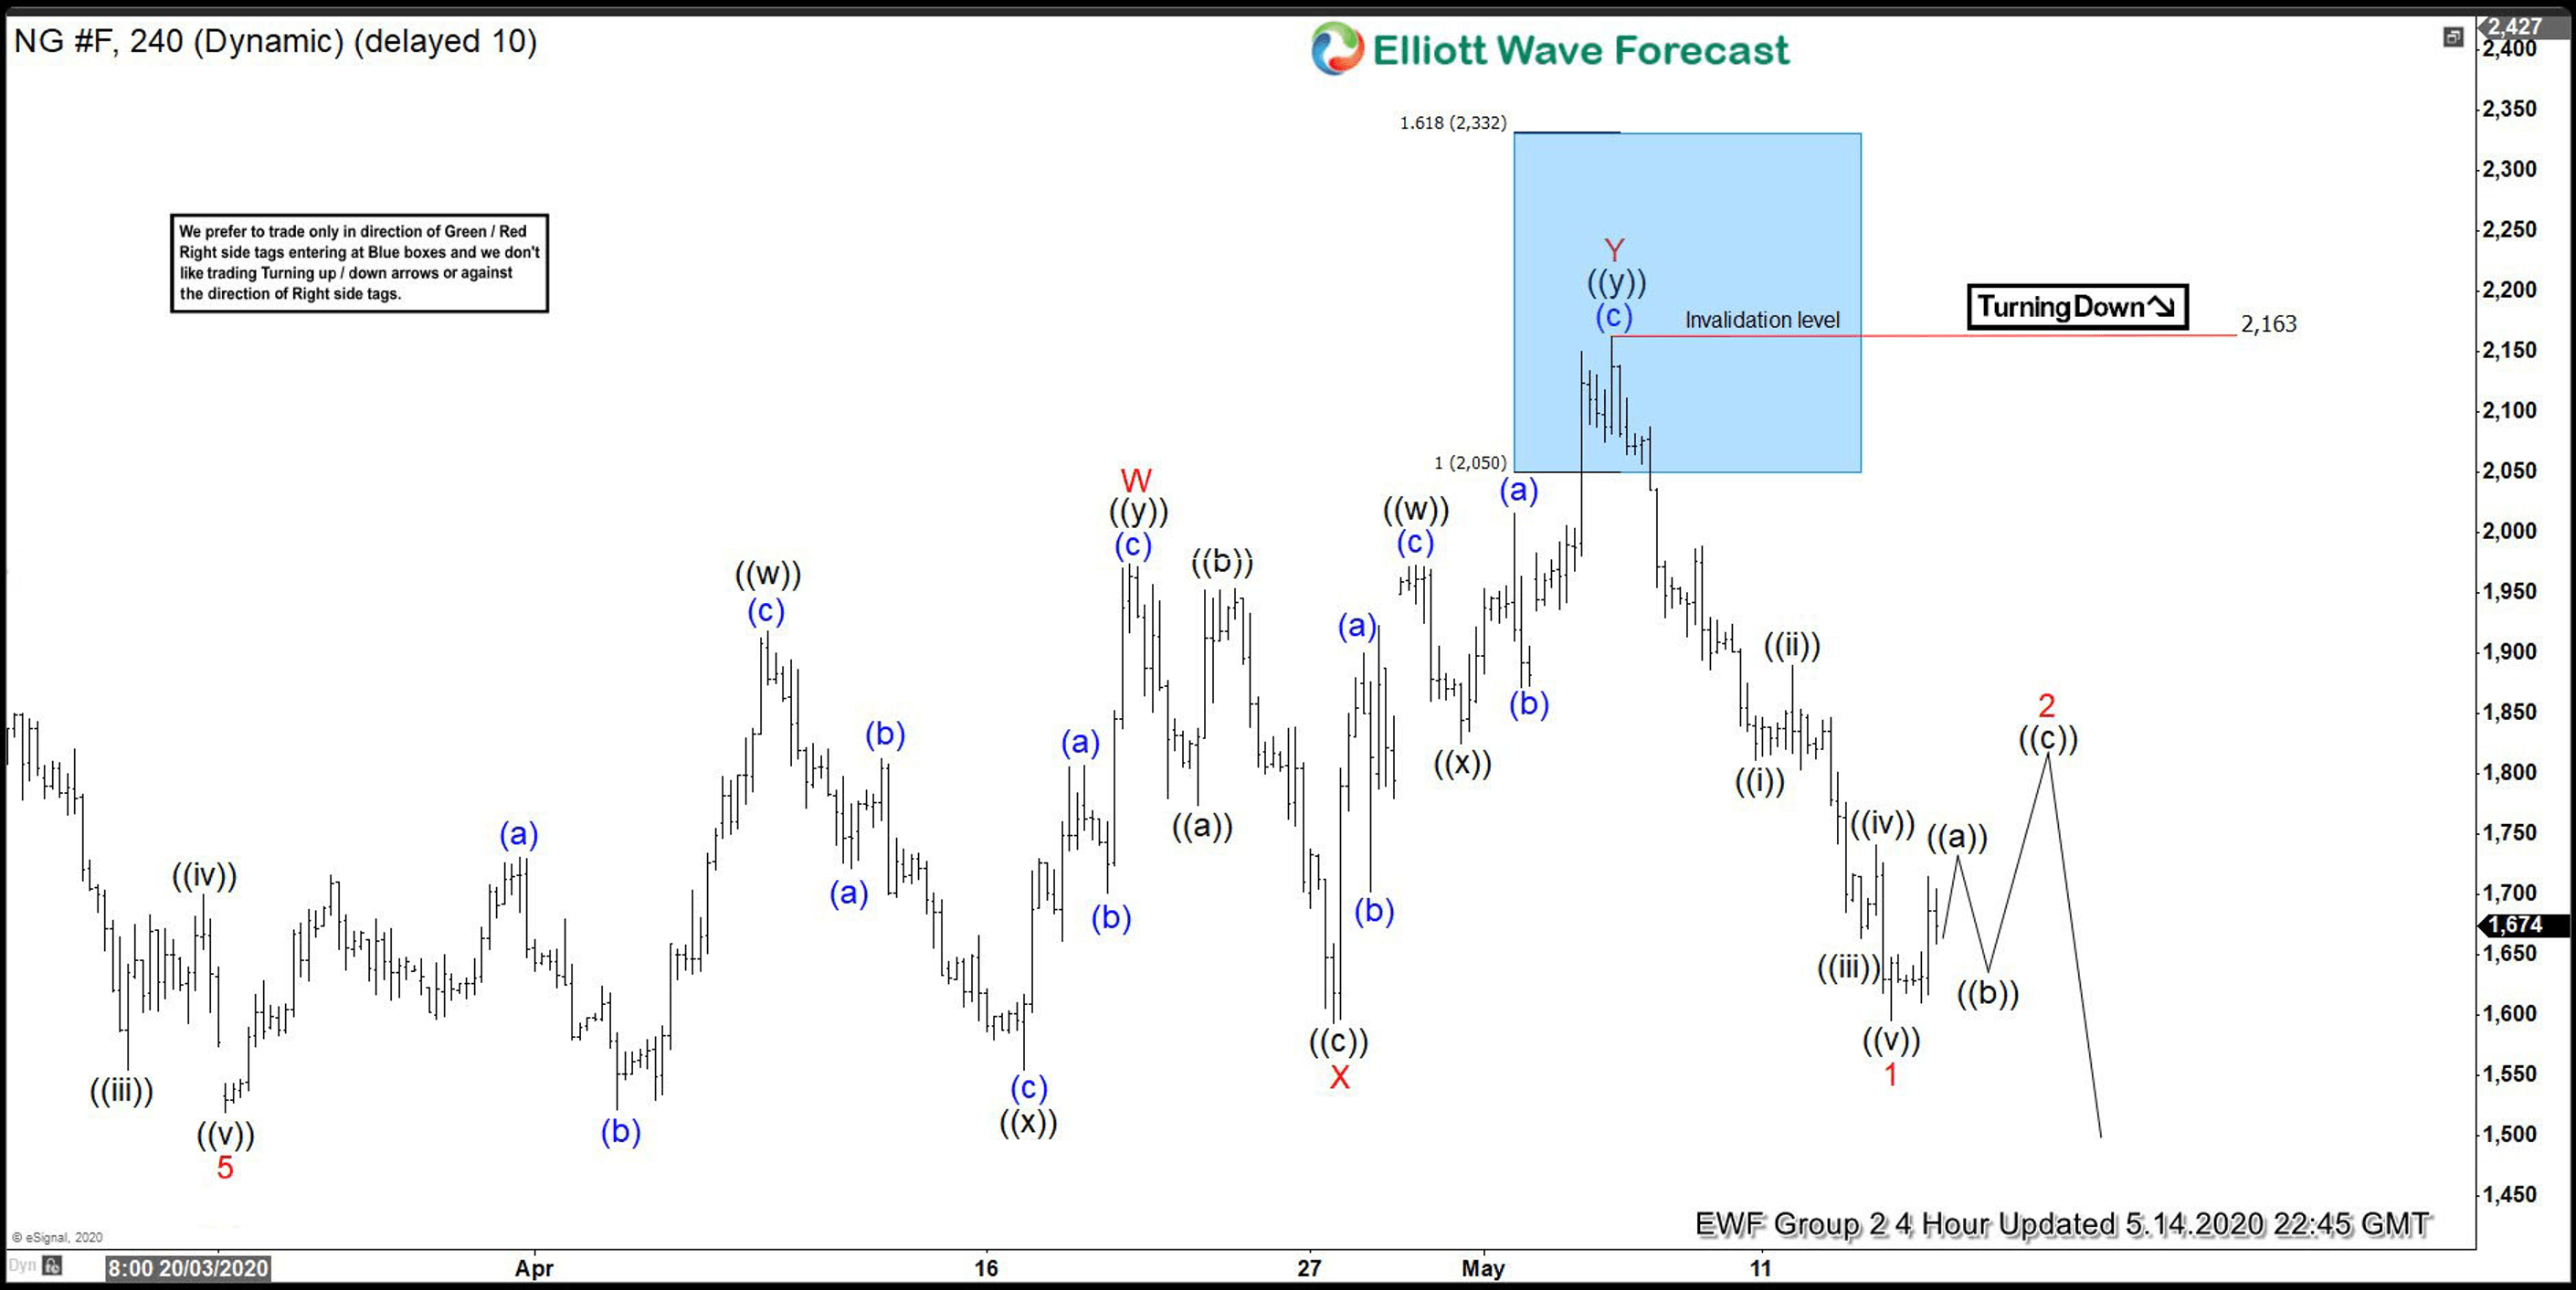
In this blog, we are going to take a look at the Elliott Wave chart of Natural Gas (NG_F). In the previous article from May 13, 2020, we showed how Natural Gas reached the blue box area and turned lower from there.  The 4 hour chart update below from May 14 shows that the commodity has ended the decline from the blue box at 1.595 low as 5 waves impulse Elliott Wave Structure. From there, 3 waves bounce is expected to take place before the decline lower can continue. While below 2.163 high, the bounce in 3,7, or 11 swings is expected to fail for more downside later.

Natural Gas (NG_F) 14 May 4 Hour Elliott Wave Update

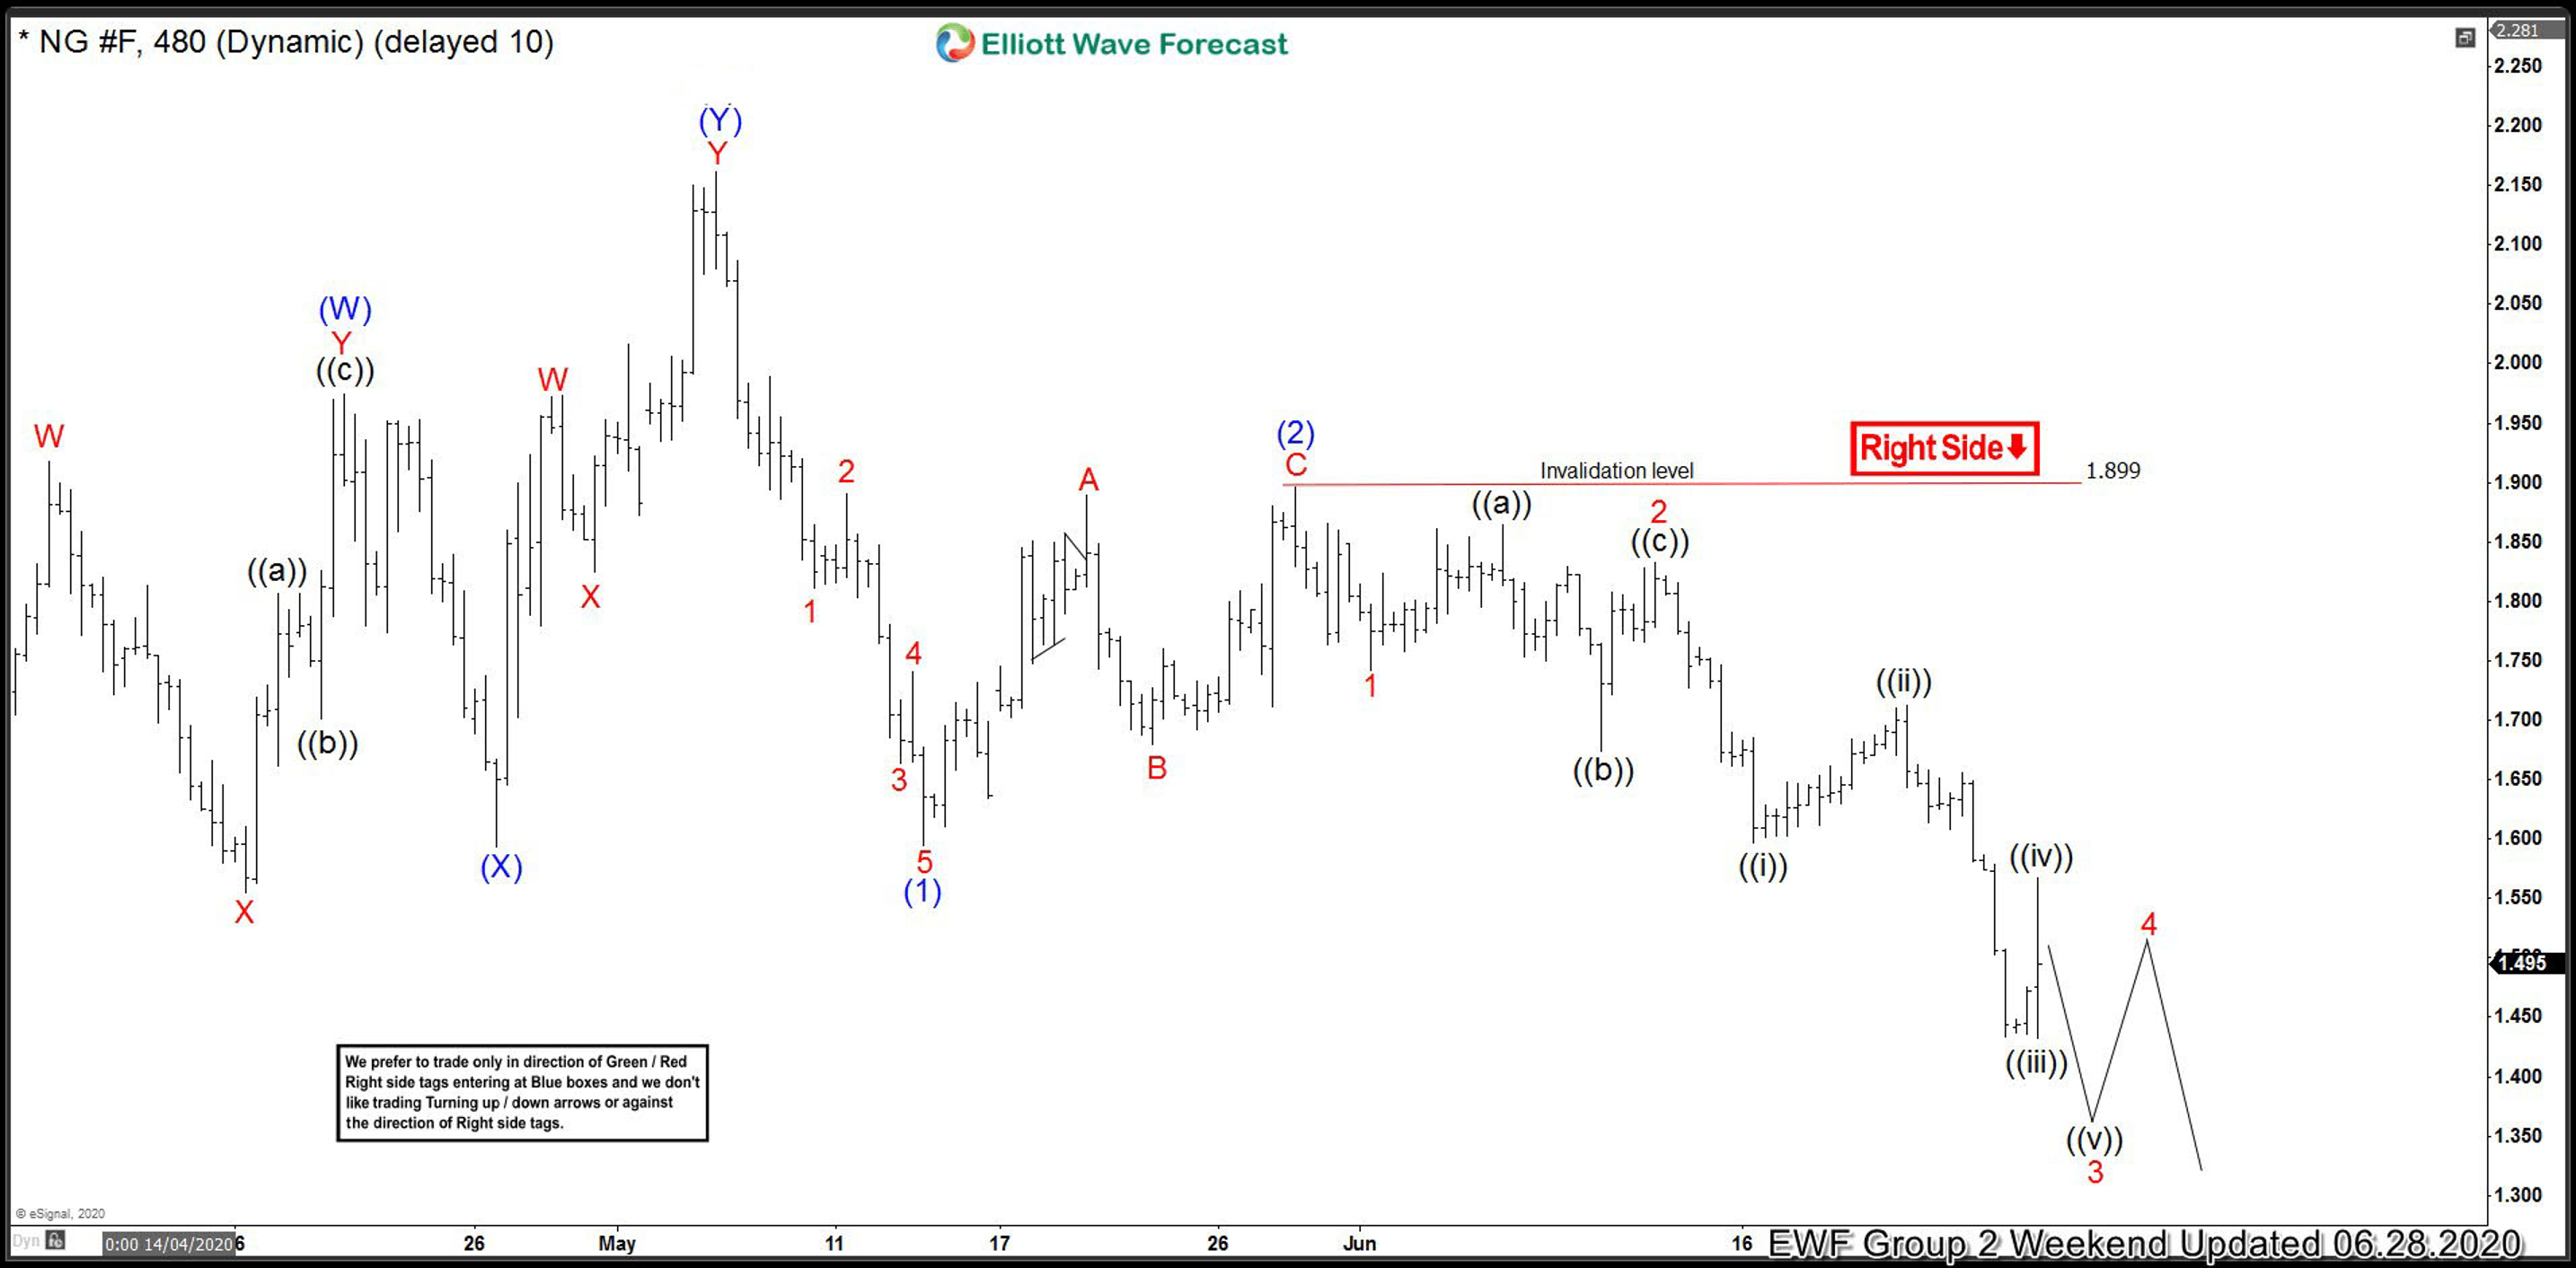
The 4 hour chart update from June 28 shows that 3 waves bounce in wave (2) has already ended at 1.899 high. The bounce unfolded as a zig-zag Elliott Wave Structure. Down from 1.899 high, Natural Gas ended wave 1 at 1.742 low. Wave 2 bounce unfolded as a flat and ended at 1.833 high.  Afterwards, the commodity resumed lower in wave 3, which is still in progress. The decline has already broken below previous wave (1) low. The commodity is now showing a lower low sequence. While below 1.899 high, expect the bounce in 3,7, or 11 swings to fail for more downside in the near term.

Natural Gas (NG_F) 28 June 4 Hour Elliott Wave Update

Author

Elliott Wave Forecast Team

Elliott Wave Forecast Team

ElliottWave-Forecast.com

More from Elliott Wave Forecast Team
Share:

Editor's Picks

EUR/USD off highs, back to 1.1850

EUR/USD loses some upside momentum, returning to the 1.1850 region amid humble losses. The pair’s slight decline comes against the backdrop of a marginal advance in the US Dollar as investors continue to assess the latest US CPI readings.

GBP/USD advances to daily tops around 1.3650

GBP/USD now manages to pick up extra pace, clinching daily highs around 1.3650 and leaving behind three consecutive daily pullbacks on Friday. Cable’s improved sentiment comes on the back of the inconclusive price action of the Greenback, while recent hawkish comments from the BoE’s Pill also collaborates with the uptick.

Gold surpasses $5,000/oz, daily highs

Gold is reclaiming part of the ground lost on Wednesday’s marked decline, as bargain-hunters keep piling up and lifting prices past the key $5,000 per troy ounce. The yellow metal’s upside is also propped up by the lack of clear direction around the US Dollar post-US CPI release.

Crypto Today: Bitcoin, Ethereum, XRP in choppy price action, weighed down by falling institutional interest 

Bitcoin's upside remains largely constrained amid weak technicals and declining institutional interest. Ethereum trades sideways above $1,900 support with the upside capped below $2,000 amid ETF outflows.

Week ahead – Data blitz, Fed Minutes and RBNZ decision in the spotlight

US GDP and PCE inflation are main highlights, plus the Fed minutes. UK and Japan have busy calendars too with focus on CPI. Flash PMIs for February will also be doing the rounds. RBNZ meets, is unlikely to follow RBA’s hawkish path.

Ripple Price Forecast: XRP potential bottom could be in sight

Ripple edges up above the intraday low of $1.35 at the time of writing on Friday amid mixed price actions across the crypto market. The remittance token failed to hold support at $1.40 the previous day, reflecting risk-off sentiment amid a decline in retail and institutional sentiment.