Natural Gas: Consolidation vs. bearish factors

After last week’s decline, natural gas started a consolidation, but is it enough to stop the sellers in the coming week?
In today’s article, I decided to focus on the short-term changes and their implications in natural gas. What can we expect in the coming days? Before I answer this question, let’s jump into the world of charts and find out what technical factors affected the recent price action.
Let’s start today’s analysis with the quote from the last commentary on natural gas published on Jan.22:
(…) the bears took the price to the mid-Dec. lows, but what’s next?
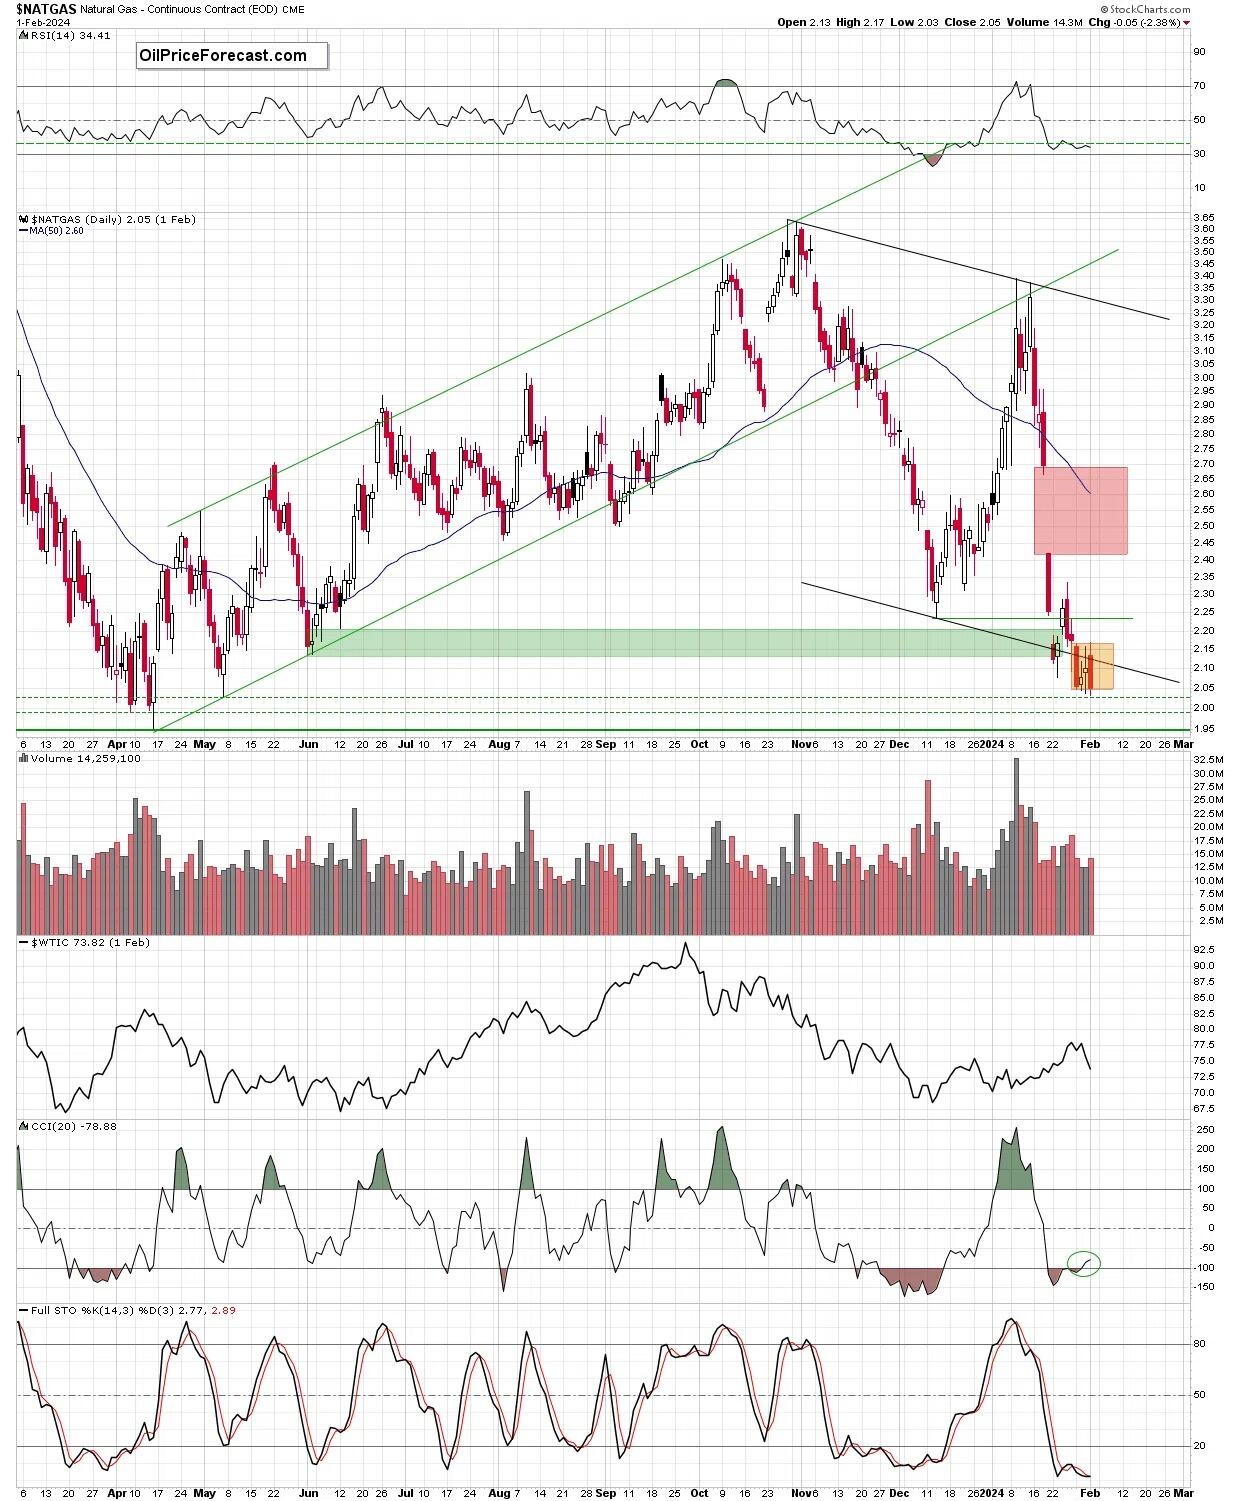
On one hand, this support could trigger a rebound, however, taking into account all the above-mentioned bearish factors, the sell signals generated by the daily indicators and the fact that natural gas lost 32% in the previous week, it seems more likely that we’ll see further deterioration and a test of the next support area (2.136-2.206) based on June 2023 lows (marked with green on the first chart) in the coming week.
At this point, it is worth noting that if the bulls fail once again, the road to the early-May 2023 or even mid-April 2023 lows could be open.
From today’s point of view, we see that we didn't have to wait long for the pro-declining scenario to materialize because on the same day when the article quoted above was published, the price tested the strength of the mentioned next support - area (2.136-2.206) based on June 2023 lows.
As you see, on the following day, the sellers tried to move even lower, but their appetite for lower prices was stopped as the buyers decided to fight. Thanks to their determination, natural gas rebounded and closed the day above the previously broken lower border of the black declining channel, invalidating the earlier breakdown.
This price action left a white candle with a prolonged lower shadow, which lured even more bulls to the trading floor. As a result, the price jumped above the previously broken green line based on the Dec.13 low, invalidating the earlier breakdown.
Despite this show of the bulls’ strength, it turned out in the following session, that the bears had not lost their will to fight and would not allow themselves to be deprived of any more points. Their attack resulted in a sharp decline that took the price below the opening of the previous candle, which resulted in another pro-declining bearish engulfing pattern.
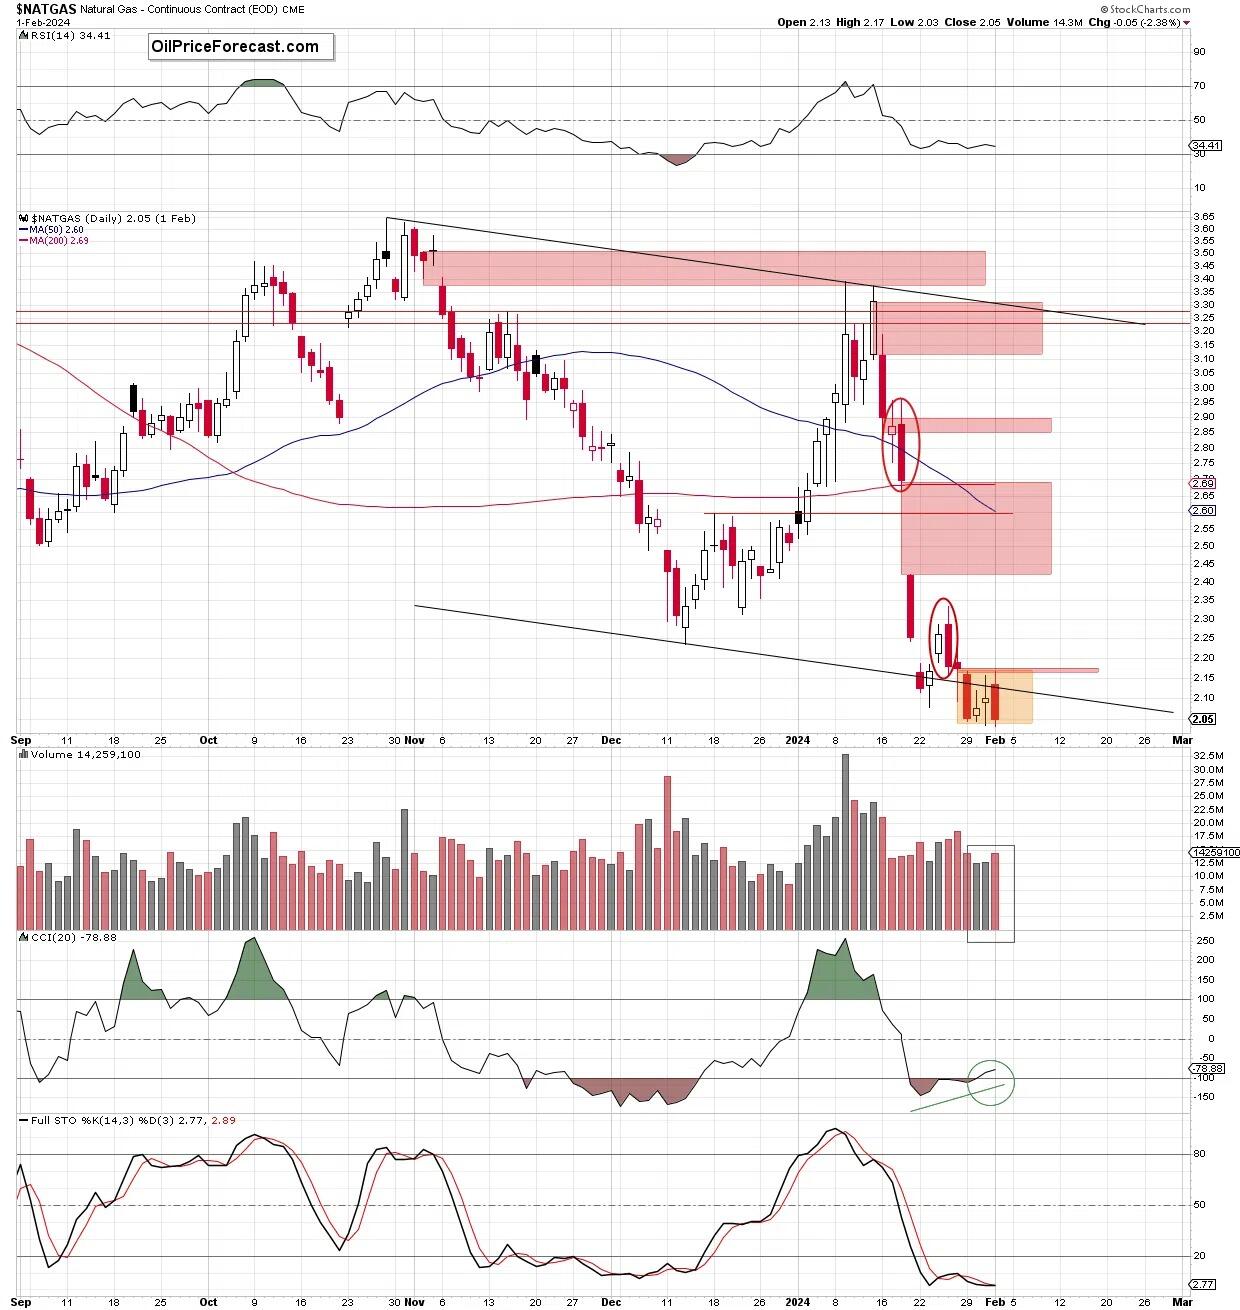
This show of the bulls’ weakness translated also into another red gap (2.159-2.175) on Jan.29 (it continues to serve as the nearest resistance at the moment), which triggered one more drop below the lower border of the mentioned declining black channel and formed a fresh multi-month low.
Although the buyers decided to fight, they didn’t manage to come back into the channel (two unsuccessful attempts to move higher), which resulted in another decline during yesterday’s session, which deepened the earlier decline and took natural gas to another low.
Taking all the above into account, the current situation of the bulls doesn’t look encouraging – especially when we factor in yesterday’s volume, which increased once again, confirming the bears’ involvement in the decline.
Additionally, when we take a look at the weekly chart below, we see that the Stochastic Oscillator generated a sell signal, giving the sellers even one more reason to act.
-638426828621359851.jpg)
So, what can we expect in the coming days?
If the sellers manage to close the day under the lower border of the orange consolidation (marked on the daily chart), we could see a decline even to around 1,928, where the size of the downward move would correspond to the height of the formation.
This scenario, however, will be likely only if the bulls do not manage to hold the support area (marked on the first daily chart) based on the mid-April and early-May 2023 lows (marked with dashed horizontal lines).
And what else could happen if the bulls failed once again and allowed the bears to move below the mentioned support zone?
The answer to this question can be found in the monthly chart below.
-638426828956998638.jpg)
From this long-term perspective, we see that if the bulls fail and are unable to defend their last ally, the road to not only mentioned 1,928, but also to the green supportive gap (1.80-1.86) could be open. At this point, it is worth nothing, that the first test of this support took place in Sep.2020, but as you see, it withstood the selling pressure and triggered a rebound, which resulted in further improvement in the following months.
Summing up, despite a short-lived rebound, the bulls failed to push the price higher, which translated into another bearish engulfing candlestick pattern, one more red gap, and a breakdown under the lower border of the black channel. Although the buyers started the consolidation inside Monday’s candle range, all the bearish factors do not bode well for higher price levels, which could translate into a test of the support area based on the mid-April and early-May 2023 lows in the very near future.
Want free follow-ups to the above article and details not available to 99%+ investors? Sign up to our free newsletter today!
Want free follow-ups to the above article and details not available to 99%+ investors? Sign up to our free newsletter today!
Author

Anna Radomska
Sunshine Profits
Anna's passion for drawing evolved into a fascination with colorful lines and shapes, which later inspired her interest in the stock market.


