Nasdaq soars to an all-time high after last Friday’s U.S. employment report which saw a massive 313,000 growth in February. This is the biggest number of jobs since July 2016, handily smashing the expectation of 200,000 jobs gain.

Elliottwave forecast

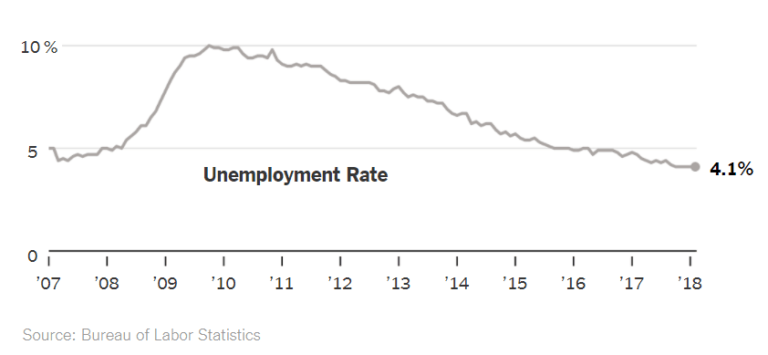
For the fifth month in a row, the jobless rate remains unchanged at 4.1%, a 17-year low.

Elliottwave forecast

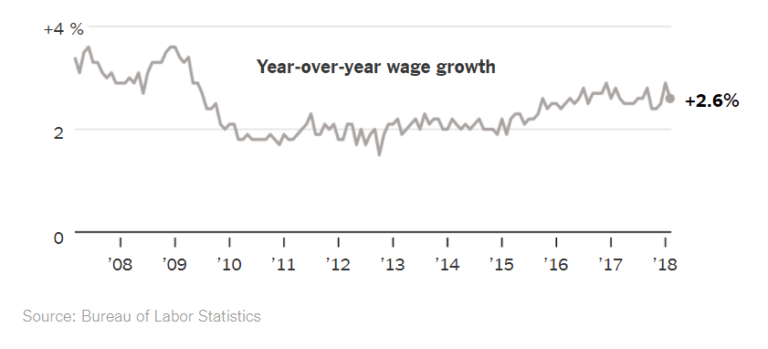
Meanwhile, wages grew less than expected, soothing the inflation fears and pointing to a gradual rise in inflation this year. Average hourly earnings grow 0.1%, a slowdown from the 0.3% rise in January. The year-on-year wage growth slows down to 2.6% from 2.9% in the previous month. Recall that a month ago a jump in wages got investors worried about inflation and set off a stock market decline, giving S&P 500 its first 10% decline in 2 years. An overheating economy raises speculation the Fed might raise rates more aggressively than it has planned. This could damper lending, hiring and business expansion.

Elliottwave forecast

The labor market benefits from strong domestic demand, improvement in global growth and strong U.S. business sentiment after President’s Trump $1.5 trillion tax cut package. Wall Street cheered the overall report ans stocks were up strongly. Nasdaq Composite regaining all of its February losses and closed at an all-time high. The Dow Jones Industrial Average and S&P 500 however remain below the old highs of late January.

For the year, Nasdaq is up nearly 8%, S&P 500 is up 3.37% while Dow Jones Industrial Average has risen over 2%. Although the payrolls report on Friday might have eased some inflation concerns, next week’s CPI (Consumer Price Index) and PPI (Producer Price Index) would be very important to watch. These two numbers are due Tuesday and Wednesday, respectively.

Nasdaq Composite Monthly Elliott Wave Chart

Elliottwave forecast

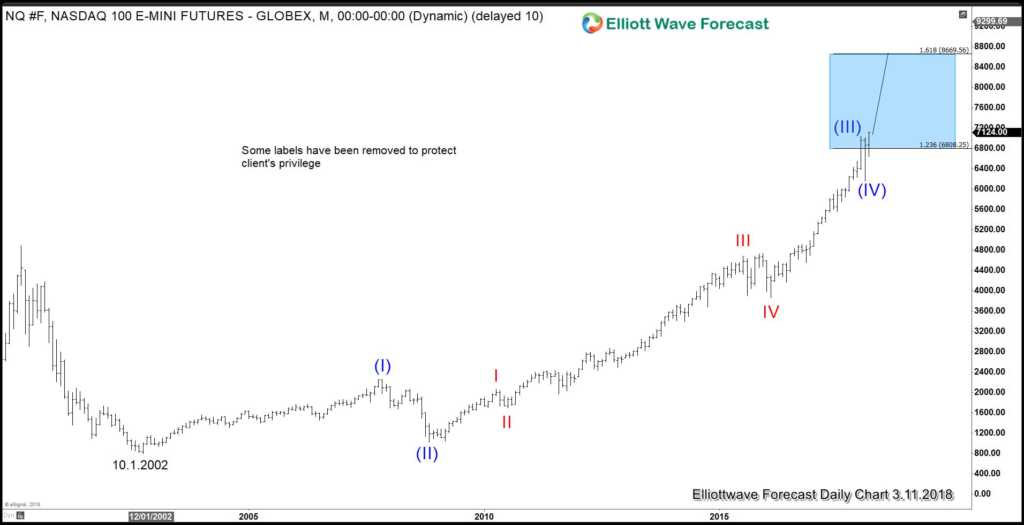
Nasdaq rally from 10.1.2002 low appears to be a clear 5 waves Elliott Wave Impulse structure with an extended wave (III). Wave (I) ended at 2256.25, wave (II) ended at 1017.75, wave (III) ended at 7047.25, and wave (IV) now confirmed to end at 6164 with break to new all-time high. While Nasdaq stays above 6164, the Index could continue higher within wave (V).

Nasdaq Composite 4 Hour Elliott Wave Chart

Elliottwave forecast

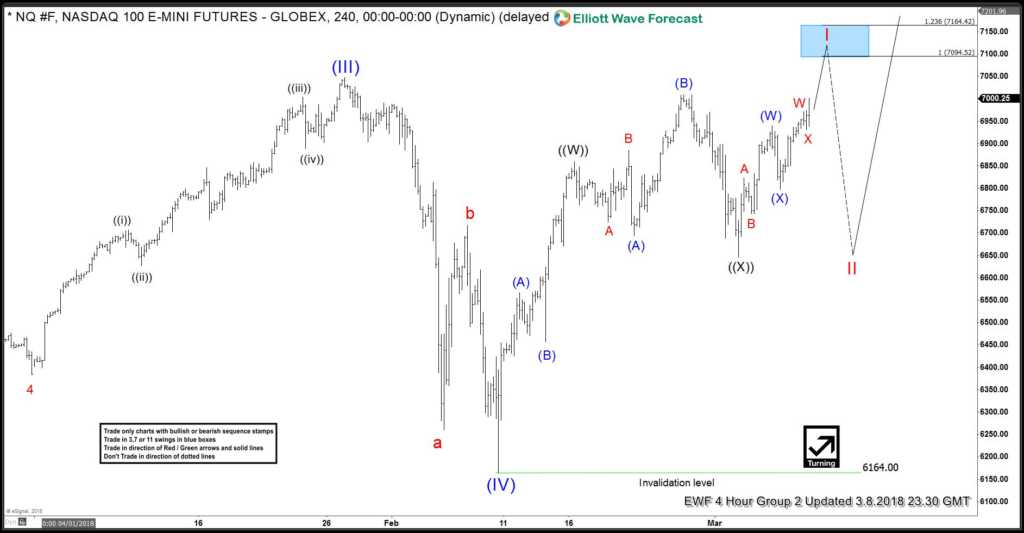
Zooming in to the 4 hour chart above, the move higher from wave (IV) at 2.10.2018 low clearly shows only 3 waves so far. As wave (V) needs to subdivide into 5 waves impulse, Nasdaq Composite should have more upside in coming weeks provided that the dips stay above wave (IV) or above 6164.

Become a Successful Trader and Master Elliott Wave like a Pro. Start your Free 14 Day Trial at - Elliott Wave Forecast.

FURTHER DISCLOSURES AND DISCLAIMER CONCERNING RISK, RESPONSIBILITY AND LIABILITY Trading in the Foreign Exchange market is a challenging opportunity where above average returns are available for educated and experienced investors who are willing to take above average risk. However, before deciding to participate in Foreign Exchange (FX) trading, you should carefully consider your investment objectives, level of xperience and risk appetite. Do not invest or trade capital you cannot afford to lose. EME PROCESSING AND CONSULTING, LLC, THEIR REPRESENTATIVES, AND ANYONE WORKING FOR OR WITHIN WWW.ELLIOTTWAVE- FORECAST.COM is not responsible for any loss from any form of distributed advice, signal, analysis, or content. Again, we fully DISCLOSE to the Subscriber base that the Service as a whole, the individual Parties, Representatives, or owners shall not be liable to any and all Subscribers for any losses or damages as a result of any action taken by the Subscriber from any trade idea or signal posted on the website(s) distributed through any form of social-media, email, the website, and/or any other electronic, written, verbal, or future form of communication . All analysis, trading signals, trading recommendations, all charts, communicated interpretations of the wave counts, and all content from any media form produced by www.Elliottwave-forecast.com and/or the Representatives are solely the opinions and best efforts of the respective author(s). In general Forex instruments are highly leveraged, and traders can lose some or all of their initial margin funds. All content provided by www.Elliottwave-forecast.com is expressed in good faith and is intended to help Subscribers succeed in the marketplace, but it is never guaranteed. There is no “holy grail” to trading or forecasting the market and we are wrong sometimes like everyone else. Please understand and accept the risk involved when making any trading and/or investment decision. UNDERSTAND that all the content we provide is protected through copyright of EME PROCESSING AND CONSULTING, LLC. It is illegal to disseminate in any form of communication any part or all of our proprietary information without specific authorization. UNDERSTAND that you also agree to not allow persons that are not PAID SUBSCRIBERS to view any of the content not released publicly. IF YOU ARE FOUND TO BE IN VIOLATION OF THESE RESTRICTIONS you or your firm (as the Subscriber) will be charged fully with no discount for one year subscription to our Premium Plus Plan at $1,799.88 for EACH person or firm who received any of our content illegally through the respected intermediary’s (Subscriber in violation of terms) channel(s) of communication.

Recommended Content


Recommended Content

Editors’ Picks

EUR/USD stays below 1.0700 ahead of US data

EUR/USD stays below 1.0700 ahead of US data

EUR/USD stays in a consolidation phase slightly below 1.0700 in the European session on Wednesday. Upbeat IFO sentiment data from Germany helps the Euro hold its ground as market focus shifts to US Durable Goods Orders data.

EUR/USD News

USD/JPY refreshes 34-year high, attacks 155.00 as intervention risks loom

USD/JPY refreshes 34-year high, attacks 155.00 as intervention risks loom

USD/JPY is renewing a multi-decade high, closing in on 155.00. Traders turn cautious on heightened risks of Japan's FX intervention. Broad US Dollar rebound aids the upside in the major. US Durable Goods data are next on tap. 

USD/JPY News

Gold manages to hold above $2,300

Gold manages to hold above $2,300

Gold struggles to stage a rebound following Monday's sharp decline but manages to hold above $2,300. The benchmark 10-year US Treasury bond yield stays in the green above 4.6% ahead of US data, not allowing XAU/USD to gain traction.

Gold News

Worldcoin looks set for comeback despite Nvidia’s 22% crash Premium

Worldcoin looks set for comeback despite Nvidia’s 22% crash

Worldcoin price is in a better position than last week's and shows signs of a potential comeback. This development occurs amid the sharp decline in the valuation of the popular GPU manufacturer Nvidia.

Read more

Three fundamentals for the week: US GDP, BoJ and the Fed's favorite inflation gauge stand out Premium

Three fundamentals for the week: US GDP, BoJ and the Fed's favorite inflation gauge stand out

While it is hard to predict when geopolitical news erupts, the level of tension is lower – allowing for key data to have its say. This week's US figures are set to shape the Federal Reserve's decision next week – and the Bank of Japan may struggle to halt the Yen's deterioration. 

Read more

Majors

Cryptocurrencies

Signatures