Nasdaq Futures made a sharp decline yesterday before reacting higher strongly into the closing for the day. In this article, we would take a look at the charts we presented to clients yesterday and the blue box area we highlighted for 3 waves decline to end and buyers to appear for the rally to resume or a 3 waves bounce at least to take place. Blue Boxes are High-Frequency areas which are based in a relationship of sequences, cycles and calculated using extensions. We also call these areas no-enemy areas because majority of the times, both buyers and sellers agree in these blue box areas in direction of the next move for 3 swings at least. Let’s start by taking a look at New York chart update from yesterday.


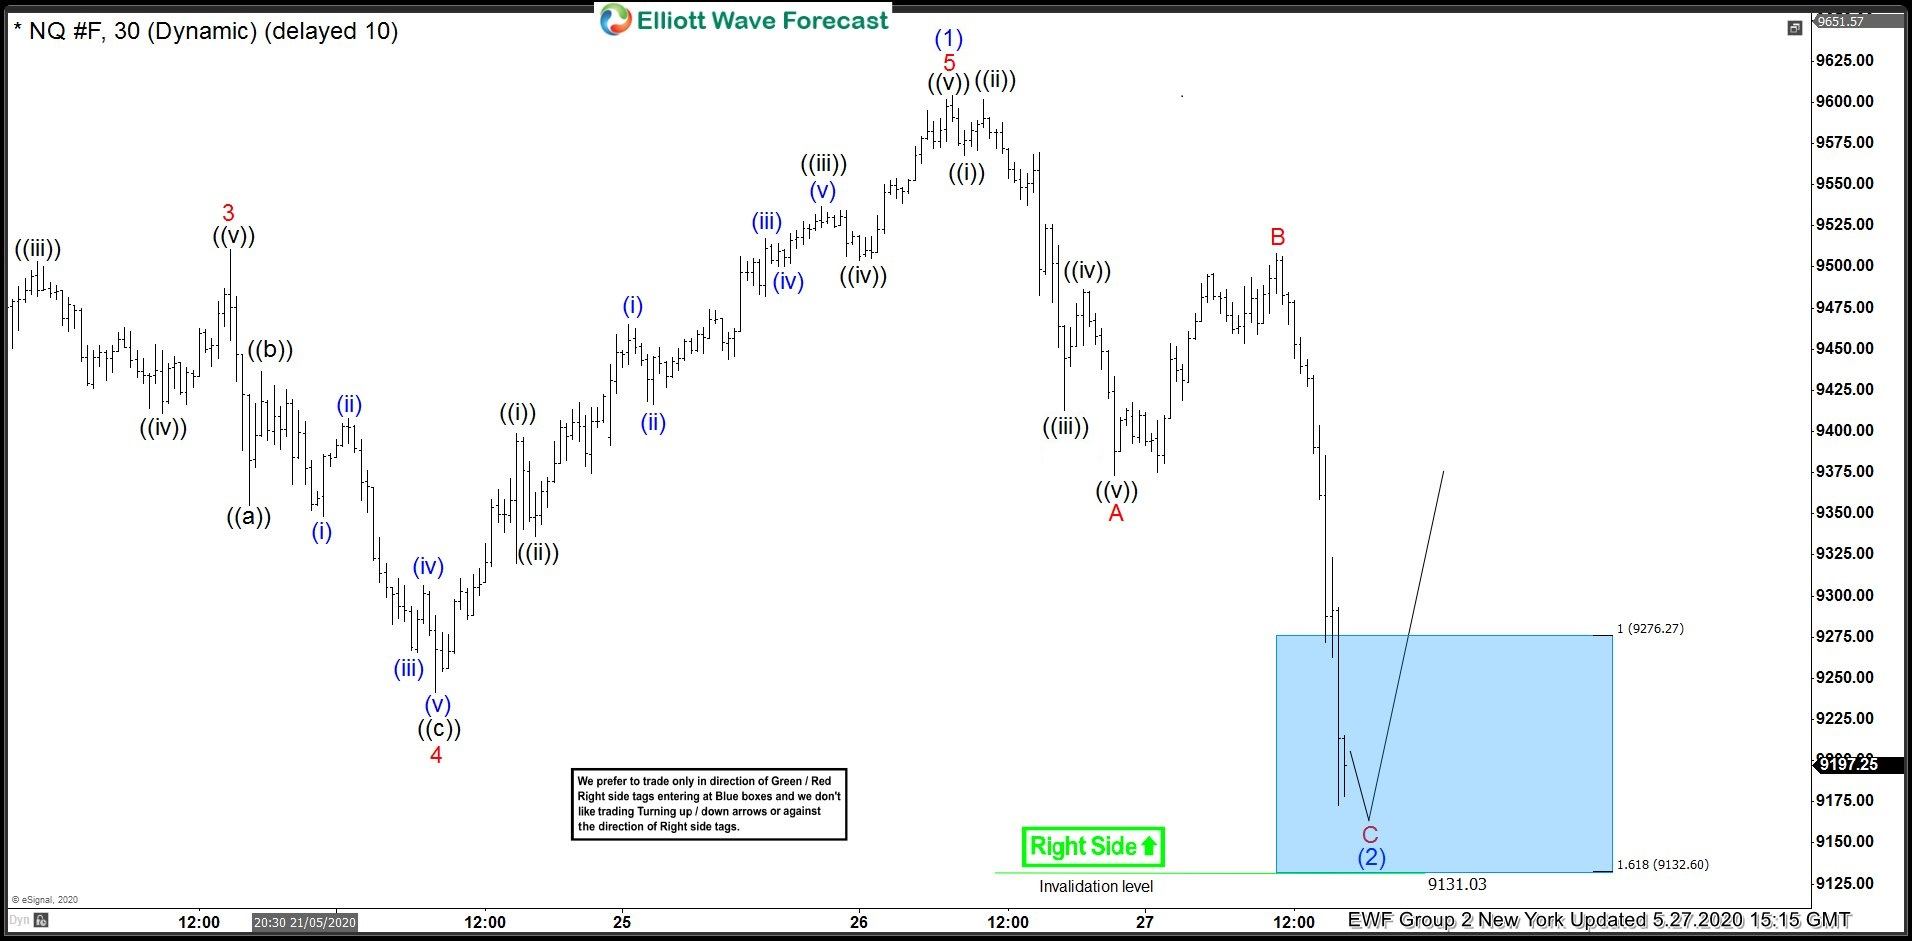
Nasdaq Futures 27 May 1 Hour New York Elliott Wave Update

Chart below shows wave (1) ended at 9604. As per Elliott Wave Theory, after a 5 wave move ends, there should be a pull back to correct the 5 waves rally and this pull back could take different forms like a Zigzag, FLAT, Double Three Elliott wave structure etc. Drop to 9373 completed wave A and this was followed by a bounce to 9508 which completed wave B and wave C of (2) was expected to complete in the blue box area shown on the chart and hold above 9131 level for a turn higher in wave (3).

NASDAQ


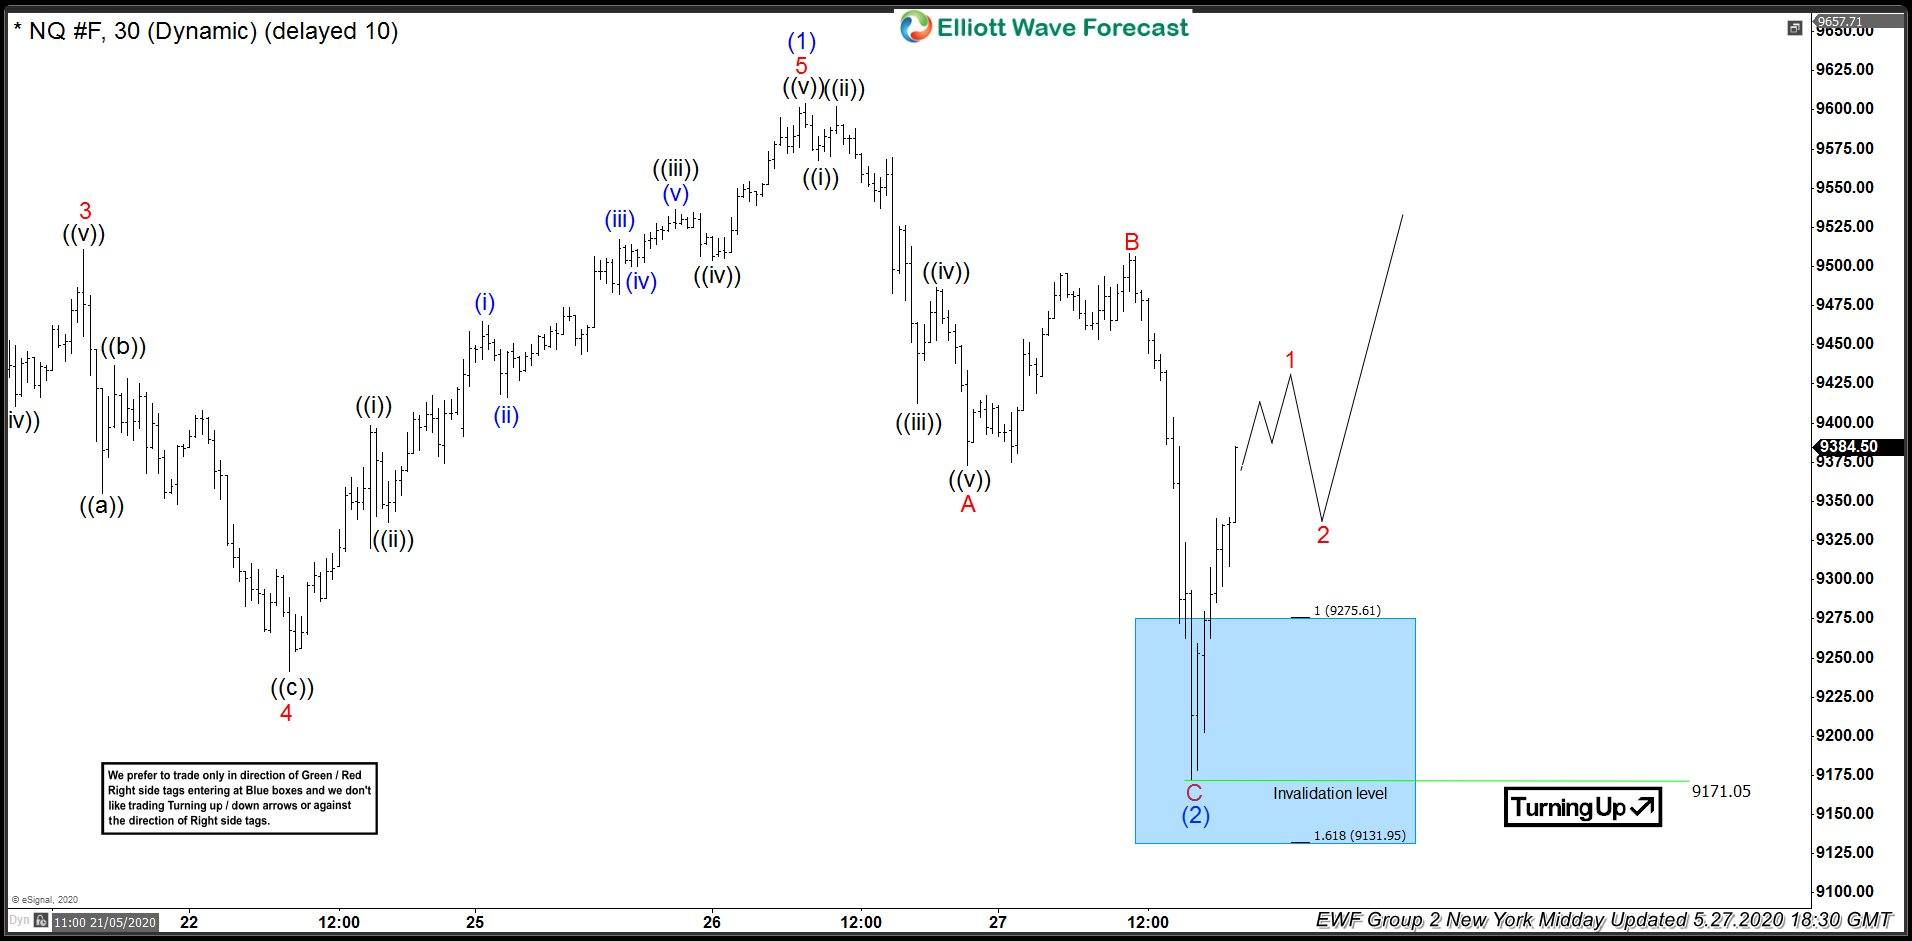
Nasdaq Futures 27 May 1 Hour Midday New York Elliott Wave Update

Chart below shows wave C of (2) completed at 9171 and Nasdaq Futures saw a sharp reaction higher after buyers entered in the blue box as expected. At the time of printing the chart, price had already reached 50% retracement of the decline from B wave high allowing any buyers which entered in blue box to eliminate risk. We expected some more upside to complete red wave 1 before a pull back in wave 2 to correct the rally from 9171 low and higher again.

Nasdaq


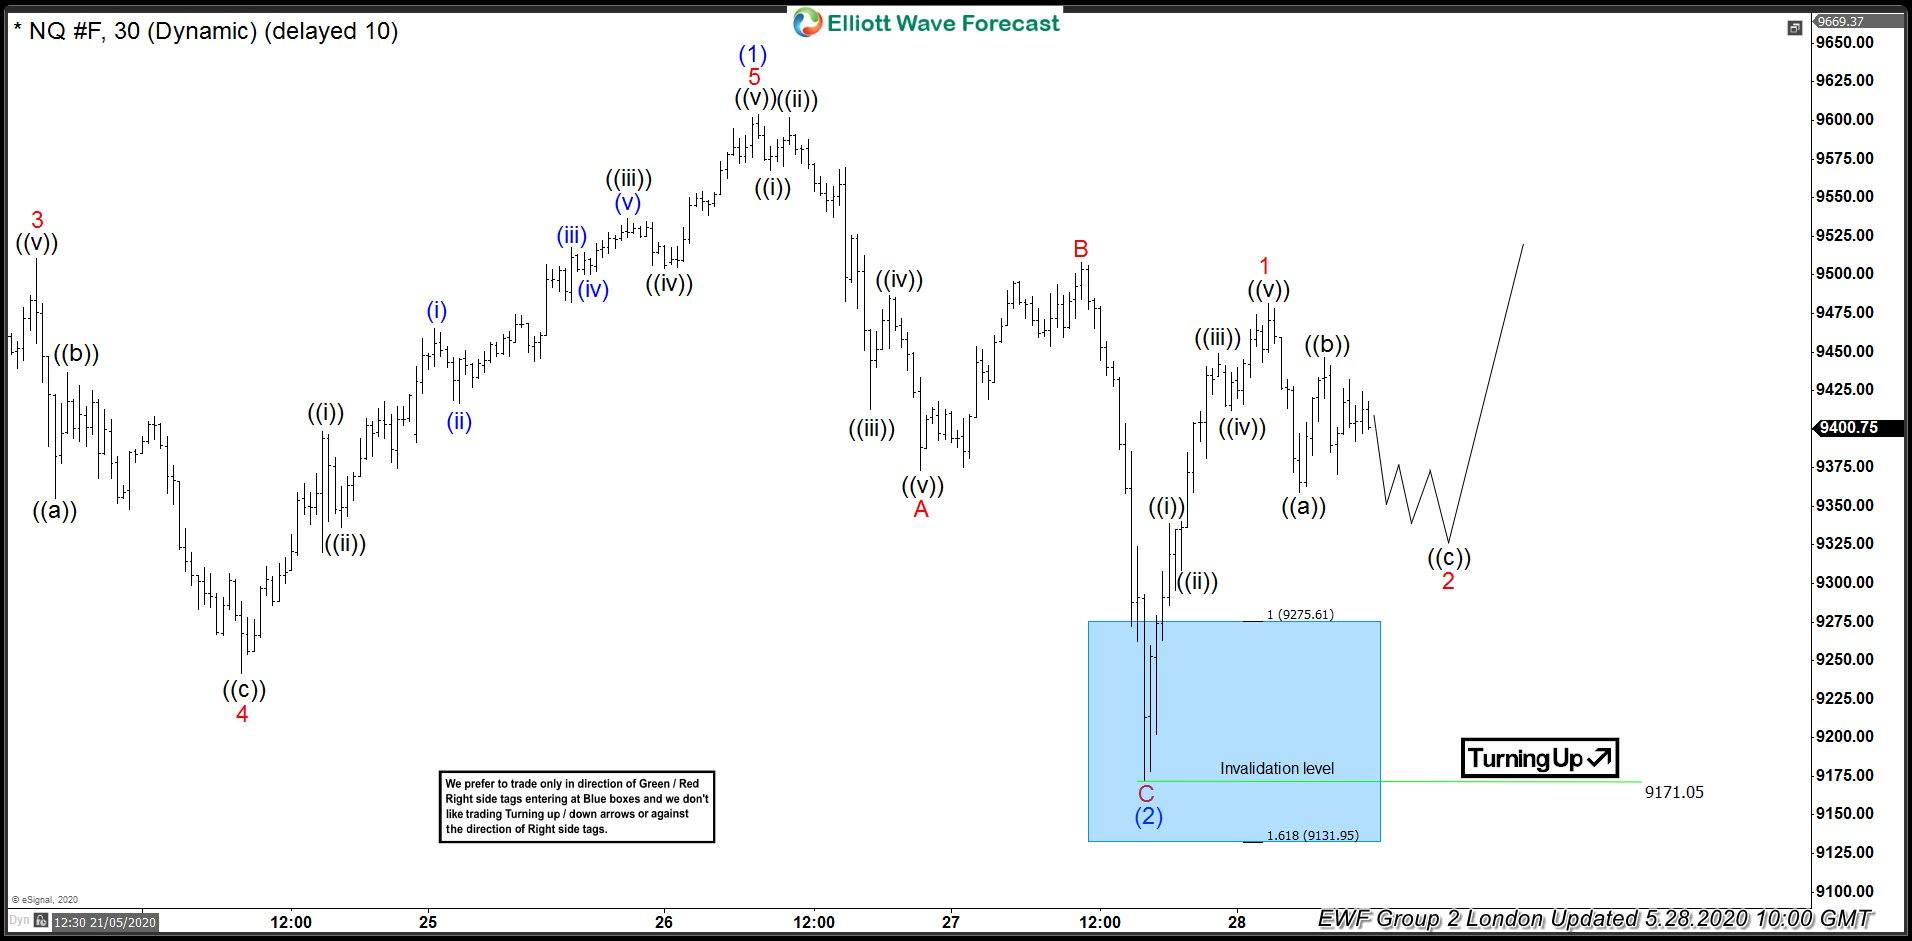
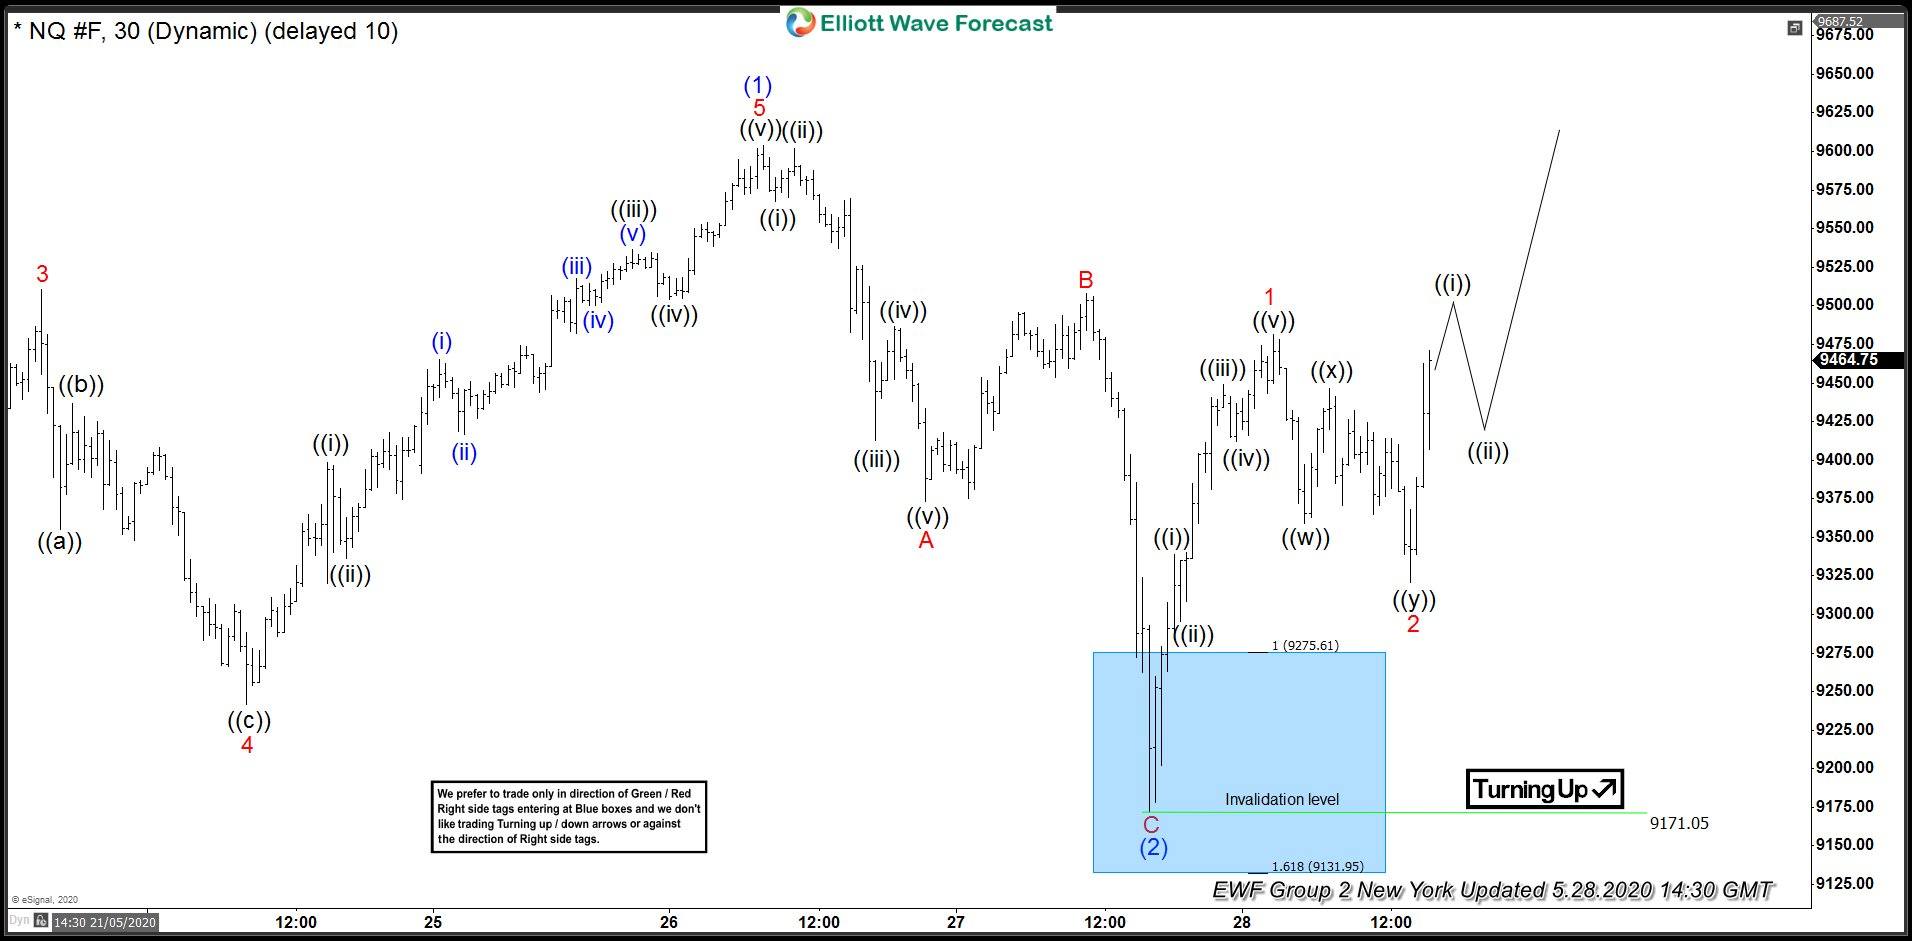
Nasdaq Futures 28 May 1 Hour London Elliott Wave Update

We complete 5 waves rally from yesterday’s low in wave 1 and now expected a pull back in wave 2 in 3 waves before the rally resumes. Price should stay above 9171 low for this idea to remain valid.

Nasdaq


Nasdaq Futures 28 May 1 Hour New York Elliott Wave Update

Chart below shows Nasdaq futures completed wave 2 pull back and are about to break above red 1 peak. A break above red 1 peak would suggest dips should hold above today’s low for extension higher toward 9631 – 9824 area within proposed red wave 3.

Chart


FURTHER DISCLOSURES AND DISCLAIMER CONCERNING RISK, RESPONSIBILITY AND LIABILITY Trading in the Foreign Exchange market is a challenging opportunity where above average returns are available for educated and experienced investors who are willing to take above average risk. However, before deciding to participate in Foreign Exchange (FX) trading, you should carefully consider your investment objectives, level of xperience and risk appetite. Do not invest or trade capital you cannot afford to lose. EME PROCESSING AND CONSULTING, LLC, THEIR REPRESENTATIVES, AND ANYONE WORKING FOR OR WITHIN WWW.ELLIOTTWAVE- FORECAST.COM is not responsible for any loss from any form of distributed advice, signal, analysis, or content. Again, we fully DISCLOSE to the Subscriber base that the Service as a whole, the individual Parties, Representatives, or owners shall not be liable to any and all Subscribers for any losses or damages as a result of any action taken by the Subscriber from any trade idea or signal posted on the website(s) distributed through any form of social-media, email, the website, and/or any other electronic, written, verbal, or future form of communication . All analysis, trading signals, trading recommendations, all charts, communicated interpretations of the wave counts, and all content from any media form produced by www.Elliottwave-forecast.com and/or the Representatives are solely the opinions and best efforts of the respective author(s). In general Forex instruments are highly leveraged, and traders can lose some or all of their initial margin funds. All content provided by www.Elliottwave-forecast.com is expressed in good faith and is intended to help Subscribers succeed in the marketplace, but it is never guaranteed. There is no “holy grail” to trading or forecasting the market and we are wrong sometimes like everyone else. Please understand and accept the risk involved when making any trading and/or investment decision. UNDERSTAND that all the content we provide is protected through copyright of EME PROCESSING AND CONSULTING, LLC. It is illegal to disseminate in any form of communication any part or all of our proprietary information without specific authorization. UNDERSTAND that you also agree to not allow persons that are not PAID SUBSCRIBERS to view any of the content not released publicly. IF YOU ARE FOUND TO BE IN VIOLATION OF THESE RESTRICTIONS you or your firm (as the Subscriber) will be charged fully with no discount for one year subscription to our Premium Plus Plan at $1,799.88 for EACH person or firm who received any of our content illegally through the respected intermediary’s (Subscriber in violation of terms) channel(s) of communication.

Recommended Content


Recommended Content

Editors’ Picks

EUR/USD clings to daily gains above 1.0650

EUR/USD clings to daily gains above 1.0650

EUR/USD gained traction and turned positive on the day above 1.0650. The improvement seen in risk mood following the earlier flight to safety weighs on the US Dollar ahead of the weekend and helps the pair push higher.

EUR/USD News

GBP/USD recovers toward 1.2450 after UK Retail Sales data

GBP/USD recovers toward 1.2450 after UK Retail Sales data

GBP/USD reversed its direction and advanced to the 1.2450 area after touching a fresh multi-month low below 1.2400 in the Asian session. The positive shift seen in risk mood on easing fears over a deepening Iran-Israel conflict supports the pair.

GBP/USD News

Gold holds steady at around $2,380 following earlier spike

Gold holds steady at around $2,380 following earlier spike

Gold stabilized near $2,380 after spiking above $2,400 with the immediate reaction to reports of Israel striking Iran. Meanwhile, the pullback seen in the US Treasury bond yields helps XAU/USD hold its ground.

Gold News

Bitcoin Weekly Forecast: BTC post-halving rally could be partially priced in Premium

Bitcoin Weekly Forecast: BTC post-halving rally could be partially priced in

Bitcoin price shows no signs of directional bias while it holds above  $60,000. The fourth BTC halving is partially priced in, according to Deutsche Bank’s research. 

Read more

Week ahead – US GDP and BoJ decision on top of next week’s agenda

Week ahead – US GDP and BoJ decision on top of next week’s agenda

US GDP, core PCE and PMIs the next tests for the Dollar. Investors await BoJ for guidance about next rate hike. EU and UK PMIs, as well as Australian CPIs also on tap.

Read more

Majors

Cryptocurrencies

Signatures