|

Nasdaq could break down soon based on this leading indicator for growth stocks [Video]

Nasdaq 100 could soon break below the support formed during October and November according to this leading indicator for growth stocks — ARKK ETF. Watch the video below to find out the why ARKK is the go to leading indicator to predict the Nasdaq movement based on the Wyckoff method.

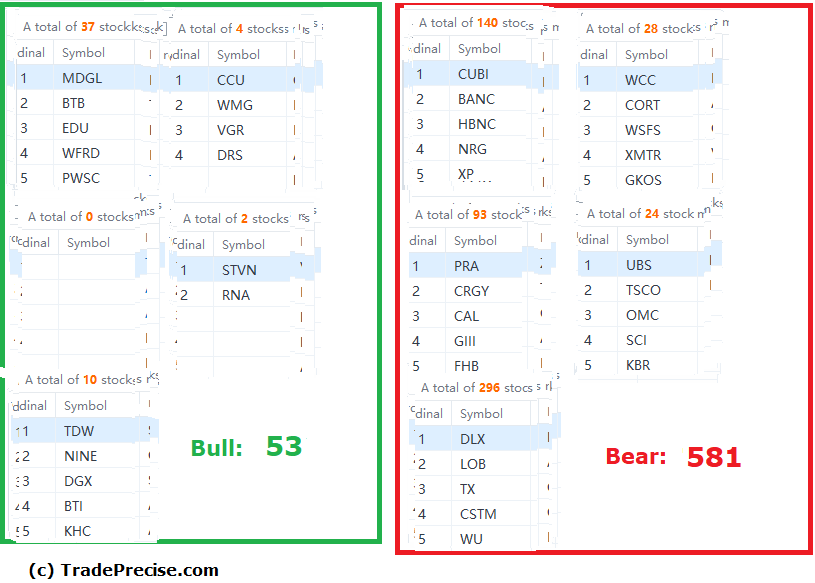
The bullish setup vs. the bearish setup is 53 to 581 from the screenshot of my stock screener below.

wyckoff stock screener

The inflection point showed up last Tuesday reacting the CPI, which was the perfect short selling entry. After several down days, S&P 500 is short-term oversold and could attempt to rally up. Traders could seek opportunities to sell on the rally for swing trading to the downside.

Author

Ming Jong Tey

Ming Jong Tey

Independent Analyst

Ming Jong Tey has been trading since 2008. He started his learning journey from technical analysis (indicators, Fibonacci, etc...) to value investing. Throughout his journey, he develops an interest in price action with chart pattern trading.

More from Ming Jong Tey
Share:

Editor's Picks

EUR/USD loses traction, breaks below 1.1900

EUR/USD comes under extra downside pressure, breaching below the 1.1900 support once again on Tuesday. The improved tone in the US Dollar keeps the pair on the back foot after two consecutive daily advances. In the meantime, prudence is expected to kick in ahead of the release of the key US Nonfarm Payrolls on Wednesday.

GBP/USD slips back to daily lows near 1.3640

GBP/USD drops to daily lows near 1.3640 as sellers push harder and the Greenback extends its rebound in the latter part of Tuesday’s session. Looking ahead, the combination of key US releases, including NFP and CPI, alongside important UK data, should keep the pound firmly in focus over the coming days.

Gold the battle of wills continues with bulls not ready to give up

Gold remains on the defensive and approaches the key $5,000 region per troy ounce on Tuesday, giving back part of its recent two day. The precious metal’s pullback unfolds against a firmer tone in the US Dollar, declining US Treasury yields and steady caution ahead of upcoming key US data releases.

Bitcoin's downtrend caused by ETF redemptions and AI rotation: Wintermute

Bitcoin's (BTC) fall from grace since the October 10 leverage flush has been spearheaded by sustained ETF outflows and a rotation into the AI narrative, according to Wintermute.

Dollar drops and stocks rally: The week of reckoning for US economic data

Following a sizeable move lower in US technology Stocks last week, we have witnessed a meaningful recovery unfold. The USD Index is in a concerning position; the monthly price continues to hold the south channel support.

XRP holds $1.40 amid ETF inflows and stable derivatives market

Ripple trades under pressure, with immediate support at $1.40 holding at the time of writing on Tuesday. A recovery attempt from last week’s sell-off to $1.12 stalled at $1.54 on Friday, leading to limited price action between the current support and the resistance.