Mystery of Inflation and Gold

At the September FOMC press conference, Yellen admitted that subdued inflation was a puzzle for the Fed. She said:
“This year, the shortfall of inflation from 2 percent, when none of those factors is operative is more of a mystery, and I will not say that the committee clearly understands what the causes are of that.”
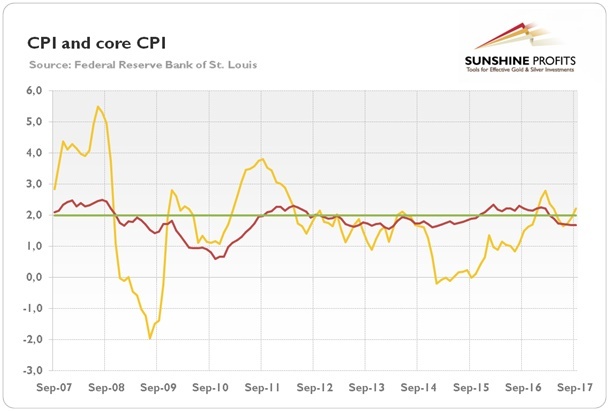
Actually, the chart below shows that inflation has been subdued for years. The last time when the CPI was above the Fed’s 2-percent target (formally set in January 2012) in a decisive and lasting way was in 2011 and at the beginning of 2012.
Chart 1: CPI (yellow line) and core CPI (red line) as a percent change from year ago over the last 10 years.
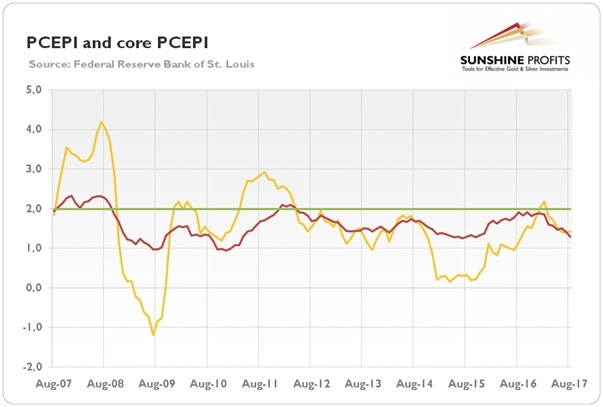
The same applies to the PCE price index, which is the Fed’s preferred gauge of inflation), as one can see in the chart below.
Chart 2: PCE Price Index (yellow line) and core PCE Price Index (red line) as a percent change from a year ago over the last 10 years.
Let’s try to solve the ‘mystery’ of low inflation in recent years. According to Yellen, there are several possible explanations. In her September press conference and speech in Cleveland, she pointed out the following factors:
-
the decline in energy prices;
-
a strong dollar that pulled down import price inflation,
-
idiosyncratic shifts in the prices of some items, such as the large decline in telecommunication service prices seen earlier in the year;
-
the decline in long-term inflation expectations;
-
the slack in the labor market;
-
the growing importance of online shopping; or
-
increased competition from the integration of China and other emerging market countries into the world economy.
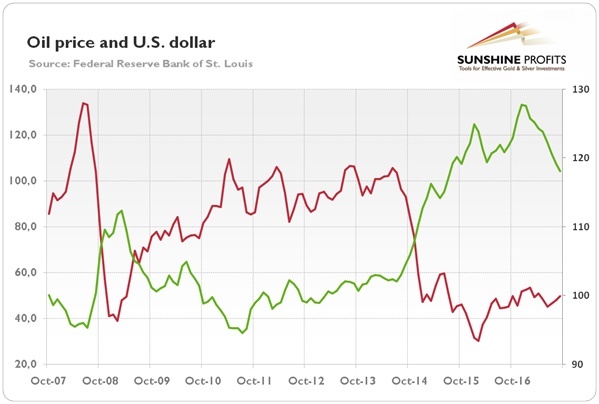
However, we can easily exclude some of them. Surely, the drop in oil prices and the appreciation of greenback contributed to the subdued inflation. But the biggest declines in oil prices and the strongest gains in the greenback occurred only from the mid-2014 to the beginning of 2016, as the chart below shows. Hence, these factors cannot explain the subdued inflation in other periods.
Chart 3: Crude oil price (red line, left axis, WTI) and the U.S. dollar index (green line, right axis, broad trade weighted index) over the last 10 years.
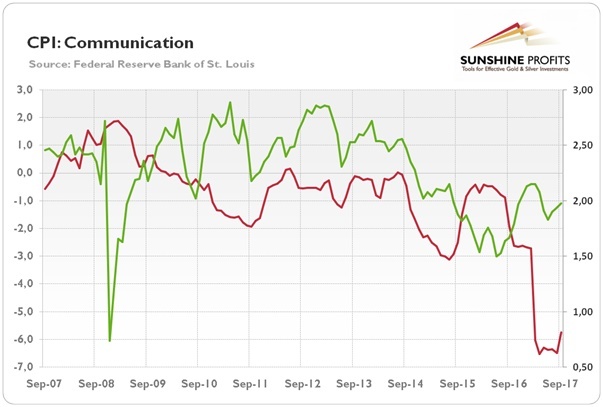
Similarly, although there was a plunge in communication prices this year, as one can see in the chart below, these idiosyncratic changes could not itself explain why inflation was subdued in earlier years. The same applies to the inflationary expectations. Their decline was caused by the drop in oil prices. But when the price of oil stabilized, the expectations of future inflation rebounded.
Chart 4: Consumer Price Index for Communication (red line, left axis) and inflation expectations (red line, right axis, 5-year, 5-year forward inflation expectation rate) over the last 10 years.
Let’s now analyze the slack in the labor market as the potential reason of low inflation. This explanation results relies on a Phillips Curve, which is one of the Fed’s key assumptions. The story goes that when unemployment gets lower, the wages and, thus, the inflation rate should pick up. Hence, the lack of inflation has to result from the hidden slack in the labor market, despite the unemployment rate being at multi-year low. The problem is that the Philips Curve is a flawed concept and it should be discredited completely after the 1970s stagflation.Inflation is not caused by higher wages – the prices may generally rise only if there is increase in the money supply. As Milton Friedman said, inflation is always and everywhere a monetary phenomenon, or, to be more precise, it is caused by too much money chasing too few goods.
Hence, the supply-side factor mentioned by Yellen, i.e. technology and globalization could contribute to limited inflation, as they increase the supply of goods. Just think about the global value chains and the increased integration of low-cost emerging market economies into global economy. The strengthened worldwide economic integration results in the stronger competitive pressures and, thus, limited the pricing power of domestic firms.
There is certainly some truth in that explanation. But China, India and other emerging markets did not emerge in the 2010s. Another problem is that global productivity growth has been actually slowing down since 2010.
So let’s look at monetary factors. The chart below shows that the rate of money supply growth has been declining since 2012. Similarly, one can see the steady decline in the velocity of money over the years.
Chart 5: Velocity of M2 money stock (red line, left axis, rate) and the annual percent growth rate of M2 money stock (green line, right axis) over the last ten years.
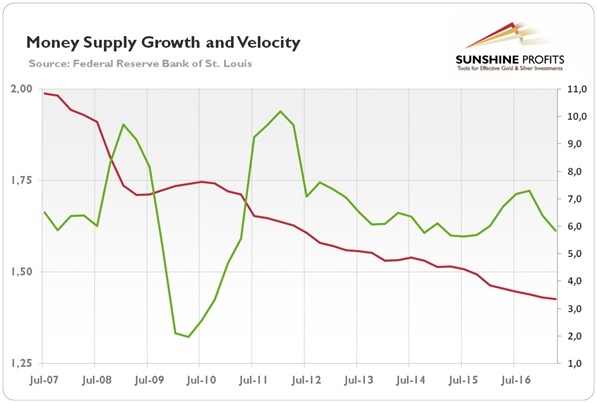
Given the equation of exchange, which states that MV=PQ (M stands for money supply, V for velocity of money, P for price level and Q for an index for index of real expenditures; we are aware of significant problems with that formula, but let’s accept it for the sake of discussion), the subdued inflation should not be surprising. Although the money supply growth is rising faster than the productivity, the velocity of money is declining, exerting downward pressure on inflation.
What does it all mean for the gold market? Well, if inflation is a monetary phenomenon, it may rebound only when the money supply or/and the velocity of money will accelerate. We do not see signs of such a pickup. However, the Fed’s tightening may paradoxically trigger higher inflation – this is because higher interest rates will reduce the demand for money. However, given the gradual pace of Fed’s hiking, the U.S. economy should remain in the goldilocks economy, which would not trigger gold’s rally. The yellow metal shines the most during either high inflation or significant deflation – we expect neither of these scenarios to occur in the near future.
Want free follow-ups to the above article and details not available to 99%+ investors? Sign up to our free newsletter today!
Author

Arkadiusz Sieroń
Sunshine Profits
Arkadiusz Sieroń received his Ph.D. in economics in 2016 (his doctoral thesis was about Cantillon effects), and has been an assistant professor at the Institute of Economic Sciences at the University of Wrocław since 2017.


