Monthly market outlook: Data reveals only the 'tip of the iceberg' – The worst is yet to come
Monetary Policies
March 2020 was a very busy, record month for the US Federal Reserve. 2nd March, the Fed announced a reduction in its benchmark rate by 50 basis points to 1%-1.25%; 9th March, the amount offered in daily overnight repo operations was increased from $100 billion to $150 billion. Also, the amount offered in the two-week term repo operations was increased from at least $20 billion to $45 billion. On 12th March, the Fed announced it would pump up to $1.5 trillion into the financial system to calm market tumult caused by the coronavirus meltdown. On 15th March, the FED announced a massive interest rate cut by 100 basis points to near zero, and at the same time, it officially announced the launch of a new round of the QE program that will entail the purchases of as much as $700 billion worth of Treasuries and mortgage-backed securities (MBS). The Fed also took coordinated action with the Bank of England, the European Central Bank, the Bank of Japan, the Bank of Canada and the Swiss National Bank to enhance dollar liquidity through existing dollar swap arrangements. On 17th March, a Primary Dealer Credit Facility (PDCF) was established to facilitate the availability of credit to businesses and households. In addition, a Commercial Paper Funding Facility (CPFF) was also established to facilitate the issuance of term commercial paper by eligible issuers. On 18th March, a Money Market Mutual Fund Liquidity Facility (MMLF) was set up to assist money market funds in meeting demands for redemptions by households and investors. On 19th March, the Fed announced the establishment of temporary US dollar liquidity arrangements with the nine central banks (South Korea, Singapore, Australia, Sweden, Brazil, Mexico, New Zealand, Norway and Denmark) to help lessen strains in global US dollar funding markets. On 20th March, the Fed increased its MBS purchases from $15 billion to $36 billion as well as expanding its MMLF to include municipal bonds eligible as collateral. On 23rd March, Fed announced that it would purchase unlimited treasuries and MBS through signalling of unlimited QE to further support smooth market functioning. Finally, the Fed offered liquidity to foreign central banks through the introduction of a FIMA Repo Facility on 31st March which allows the latter, who own accounts at the New York Fed, to sell treasuries to the Fed’s Open Market Account as a means to raise Dollars, and later agreeing to buy them back at the maturity of the repurchase agreement. This method will effectively prevent foreign central banks from panic selling their US Treasury holdings, thus stabilizing foreign dollar markets which will eventually benefit the US economy including market confidence and trade. A truly unprecedented and record breaking month for the “world’s central bank”.
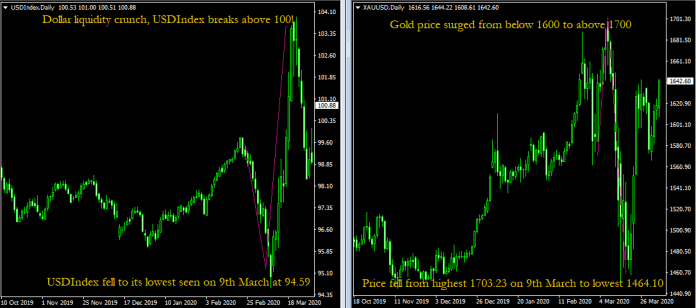
Following the Fed’s announcement that it will reduce its benchmark rate as well as increase its daily overnight repo operations, the USDIndex fell to its lowest on 9th March, at 94.59. However, the Greenback has managed to recoup its losses following the dollar liquidity crunch, which later sent the dollar index back to a strong rebound above the 100 threshold. Additionally, US stock indices were seen to hit four rounds of Limit Down within just 10 trading days. The financial market ‘free-fall’ only managed to stall posting lows on March 23rd, after the Fed launched its ‘infinite QE’ programme. However, the unlimited QE has brought about adverse effects especially to the Gold markets. XAUUSD was seen to rebound from below $1600/troy ounce to above $1700/troy ounce following the Fed’s announcement that it will reduce interest rates in early March. However, the safe-haven asset price tumbled from its highest at $1703.23/troy ounce seen on 9th March for nine consecutive trading days to its lowest at $1464.10/troy ounce. The safe-haven asset price has fell by over $240 within just ten trading days. Following the Fed’s announcement that it will launch unlimited QE, there was a surge in demand for gold (physical gold in particular). However, the vast majority of gold refineries and air travel that was forced to shut down amid the coronavirus outbreak has resulted in an interruption of the supply chain for gold. Illiquidity (with increased volatility) has led to abnormal price quotes over different brokerages, and there was periodic suspension of price quotes seen as well. In an effort to resolve the physical gold squeeze, the Chicago Mercantile Exchange (CME) announced the launch of a new gold futures contract with delivery options that include 100-troy ounce, 400-troy ounce and 1-kilo gold bars to cater to the growing market demand, thus relieving liquidity issues.¹
At present, the question remains as to what extent the series of monetary policies implemented by the Fed could benefit the market. After all, unlike the financial crisis in 2008 when the Fed focused on supporting only the banking system, pressure is real for almost all industries – from US treasury bonds to municipal bonds to currency market mutual funds. Also, the Fed’s monetary policy has its own limitations. As of now, the Fed’s monetary policy does not include purchasing high-yield bonds (junk bonds) and leveraged loans. Therefore, as some analysts have pointed out, the default rate of these high-risk industries could reach as high as 15% within just two years². In addition, the Fed’s MBS purchases may not be suitable for private label securities, which include bonds issued before the 2008 Financial Crisis. On the contrary, the scale of capital injection following the Fed’s decision to launch unlimited QE has repeatedly hit record highs. As of 1st of April, the Fed’s balance sheet has expanded to $5.86 trillion, which accounted for more than 6% of GDP, equivalent to the total increase throughout the QE1 period. According to Bank of America’s Merrill Lynch, the Fed’s balance sheet may double to about $9 trillion by the end of this year.
What appears almost certain for now is that the Fed has a high possibility to keep its interest rates at 0-0.25% for an extended period (possibly until the end of 2021) and at least until the economy is gradually recovering, employment is fully restored, and the inflation rate has reached the Fed’s symmetrical 2% target. The Fed may also adopt some form of yield curve control, considering that an extremely high fiscal deficit may result from measures taken to recover the economy.
Fiscal Policies
In an attempt to help the US economy recover from the threat of the coronavirus outbreak, President Trump has officially signed a $2 trillion coronavirus relief bill. The package³ includes:
-
$1200 in cash being distributed to most American adults and $500 in cash to most American children. Individuals with personal annual income of more than $99,000 and couples’ income of more than $198,000 are not entitled for the benefit.
-
An extra $600 per week for any unemployed person on top of whatever amount individual state governments are providing, for up to 4 months.
-
Forgivable loans up to $10 million per Small Business to maintain payroll and to keep workers on the books, as well as to pay for rent.
-
Tax credits allowed for any company hit by the virus that keeps workers on the payroll, up to 50% of wages paid during the crisis.
-
Creation of a $500 billion pool of taxpayer money to make loans, loan guarantees or investments in businesses, states and municipalities that are damaged by the crisis.
-
$117 billion injected into hospitals and veterans’ health care, with another $16 billion injected for strategic national stockpile of pharmaceutical and medical supplies.
-
$25 billion granted to airlines and $4 billion granted to cargo carriers to be used for paying employee wages and benefits, with another $25 billion and $4 billion for loans and loan guarantees also set aside.
-
Ban companies that have received government loans from buying back stock until a year after the loan is repaid.
-
Bar employees with an annual salary over $425,000 last year from getting a pay raise.
-
President Donald Trump, Vice President Mike Pence, heads of executive departments, members of Congress and their relatives are not entitled to receive emergency taxpayer relief.
-
Suspension of the Federal student loans repayment until September 30, with no interest accrued during the period.
Nevertheless, the government’s fiscal policy did not effectively alleviate the huge impacts that the economy is currently facing. Economists from Morgan Stanley⁴ have pointed out that the stimulus plan can only, at best, help to limit US economic losses to mid-2021. It is estimated that the second quarter US real GDP will fall by 30%. The airline industry is the industry that has been affected the most by the coronavirus pandemic. According to the CEO of Delta Air Lines, Ed Bastian, the company is losing over $60 million cash every day due to reduction in flight schedules. The company’s revenue may reduce by a whopping 90% in the next three months.⁵
Besides that, the $2 trillion stimulus package makes no effort to suppress sharp rises in the US unemployment rate. As of the 3rd of April, the US seasonally adjusted March NFP data has recorded a new low since March 2009 with a reduction of employment by –701K, far below the forecast data at -100K and the previous data at 275K. Also, the US March unemployment rate increased from 3.5% to a record high since August 2017 at 4.4%. This is also the largest monthly increment in unemployment since the year 1975. Earlier, the release of US Initial Jobless Claims data has shown a surge to 6.6 million. The US employment situation in general is not optimistic at all.
It is worth noting that this data reveals only the “tip of the iceberg” – the worst is yet to come. Some analysts⁶ have pointed out that the outbreak of coronavirus may cause the US unemployment rate to rise to 10%, with over 15 million unemployment cases. In addition, the views of Fed officials are even more pessimistic. Following an interview with Loretta Mester and Robert Kaplan, both have expressed concern that the unemployment rate could hit as high as 15%, and that the US may fall into risk of recession⁷.
On the other hand, some experts have also pointed out that the US stimulus plan makes up half of the US government’s annual expenditure of 4.7 trillion US dollars. As the government has plans to bring out a new round of fiscal stimulus packages, it is likely that the accumulated fiscal deficit may take a decade or even decades to breakeven. As we mentioned in our previous monthly report, both monetary policies and fiscal policies may only temporarily smooth market functioning. The outbreak of the coronavirus has hit global demand and thus led to global economic slowdown. Until the coronavirus has been effectively contained and vaccines to fight the virus have been successfully developed, the financial market is expected to remain under pressure.
Technical Outlook
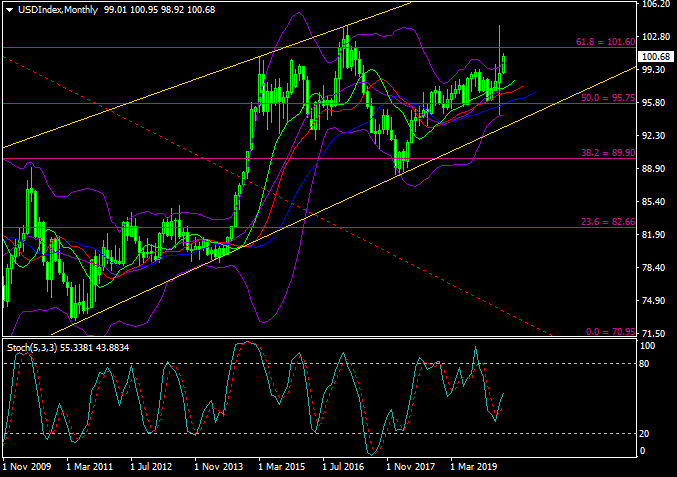
As seen in the monthly chart, USDIndex was trading within an ascending channel. Previous candlestick is seen to close well above 50.0 Fibonacci level as well as the Alligator MAs. The index is currently testing the upper Bollinger Band, hovering right below the 101.60 resistance level. The Stochastic Oscillator has formed a golden cross signal. The resistance level at 101.60 has been tested twice – first time December 2016 and second time March 2020. The index is expected to continue its third attempt to break the key zone.
Author

With over 25 years experience working for a host of globally recognized organisations in the City of London, Stuart Cowell is a passionate advocate of keeping things simple, doing what is probable and understanding how the news, c


