$MC : Luxury giant LVMH should continue trading higher
Moët Hennessy Louis Vuitton, commonly known as LVMH, is a French multinational luxury goods company. Headquartered in Paris, LMVH was formed 1987 through a merger of the fashion house Louis Vuitton (founded in 1854) with Moët Hennessy (established in 1971). The company controls and manages 75 prestigious brands under the umbrellas of 6 branches: Perfumes and Cosmetics, Wine and Spirits, Watches and Jewelry, Fashion Group, Selective Distribution, and Other Activities. LVMH is a part of CAC40 index. Investors can trade it under the ticker $MC at Euronext Paris and under $LVMHF in US in form of ADRs.
From the first days on the stock exchange, $MC title is in a permanent growth. From the fundamental point of view, this behavior may demonstrate a steady need of luxury goods in the society. Even though the wealth in the world is unequally distributed, however, the growing demand in luxury products is obviously present. The latter should be rising even stronger in the coming years. This development should advance, without any doubt, the luxury giant LVMH to new highs.
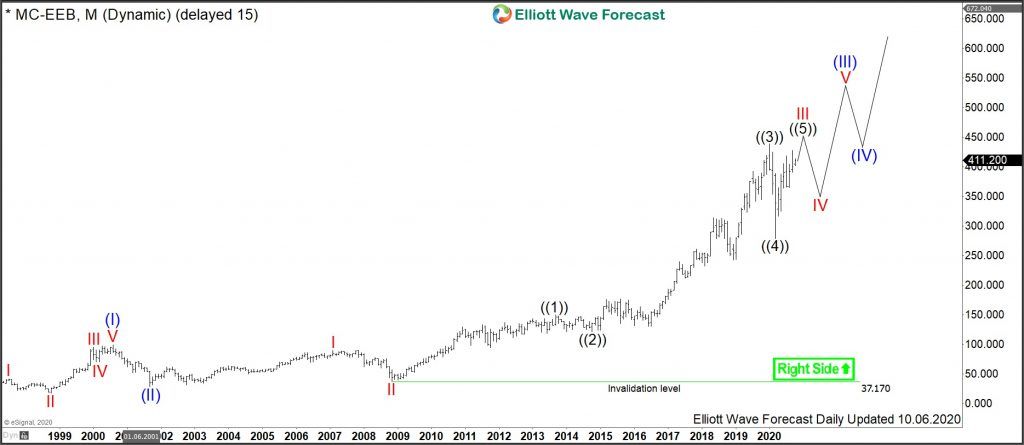
LVMH Monthly Elliott Wave Analysis 10.07.2020
The monthly chart below shows the LVMH stock $MC listed at Euronext. From the all-time lows, first, the stock price has developed a cycle higher in wave (I) of a super cycle degree. It has ended in August 2000 at 98.70. From the top, a correction lower in wave (II) has unfolded as an Elliott Wave zigzag pattern. It has printed a bottom on September 2001 at 28.40.
From the September 2001 lows, LVMH has broken to new highs and is still within a strong rally. This rise shows an extension of more than 2.618 multiples in relation to the length of the wave (I). It is approaching the 4.236 extension level which is 446.55. Without any doubt, one can qualify the cycle higher as the blue wave (III). From 2001 lows, it shows 5 waves higher. Currently, the 7th swing in black wave ((5)) of red wave III is unfolding. Breaking to new highs would confirm this count generating, at the same time, an incomplete motive sequence.
Indeed, motive sequences develop in 5 – 9 – 13 – 17 – … (5+4 x n) swings. Therefore, a new high above 439.05 will require a pullback in wave IV and another high in wave V. Later on, 9 swings may accomplish the 2001 cycle higher in blue wave (III). But they dont have to. As mentionned above, 13, 17 and more swings within cycle in wave (III) are also possible.
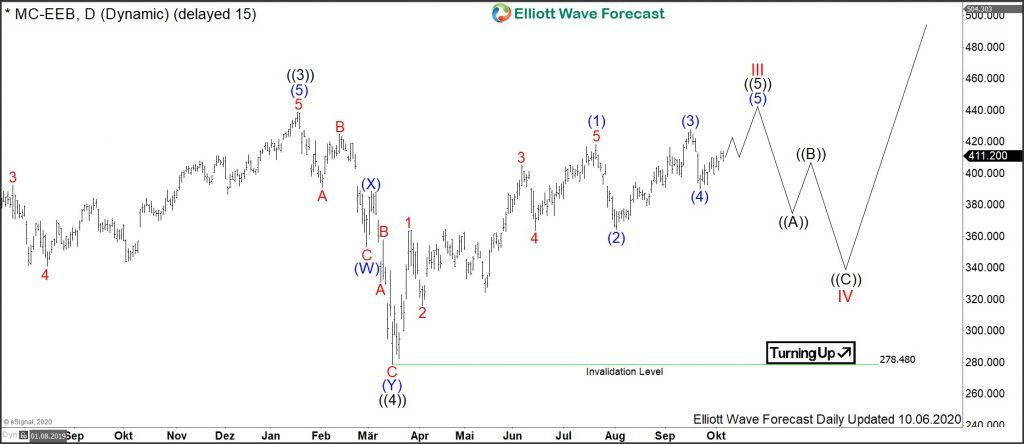
LVMH Daily Elliott Wave Analysis 10.07.2020
The daily chart below shows in more detail the waves ((3)) and ((4)) of the red wave III. From the all-time highs at 439.05, the pullback in wave ((4)) has unfolded as a double-three correction. It has ended in March 2020 at 278.48. From the lows, the advance higher is looking so far like 7 waves up. Currently, wave (5) of ((5)) is underway and should break 439.05 highs. Once topped, a correction lower in wave IV should correct the entire cycle in wave III from the 37.17 lows on November 2008. Alternatively, the pullback may correct the March cycle from 278.48 lows before turning higher again. In that case, the red wave III may be still in progress to new highs.
As a matter of fact, there are different counts which may play out. Notwithstanding, investors and traders may be looking to buy a pullback in $MC in 3, 7 or 11 swings against March lows at 278.48 in first and against 2008 lows at 37.17 in second degree for an extension higher to new all-time highs or for a bounce in 3 waves at least.
Author

Elliott Wave Forecast Team
ElliottWave-Forecast.com


