Markets get a wake up call

The current week in the financial markets has been dominated by a sharp reversal in the
AI-and-semiconductor trade that had powered equity gains through the first half of 2026. What began as modest profit-taking in US tech names quickly spiralled into a full-scale risk-off episode in Asia, culminating in the largest single-day decline in KOSPI history on Tuesday, June 23. Wall Street followed on the same day, with the Nasdaq falling roughly 2%, while gold extended its decline as a stronger US dollar and rising real-yield expectations reduced the appeal of non-yielding assets.
The selloff does not yet mark a confirmed trend reversal — the Nasdaq remains up about 10% year-to-date and roughly 5.5% below its record high set on June 2 — but it has exposed the fragility of a market structure built on extreme concentration in AI-linked names, leveraged retail products and algorithmic momentum flows.
Kospi: A record crash the day after an all-time high
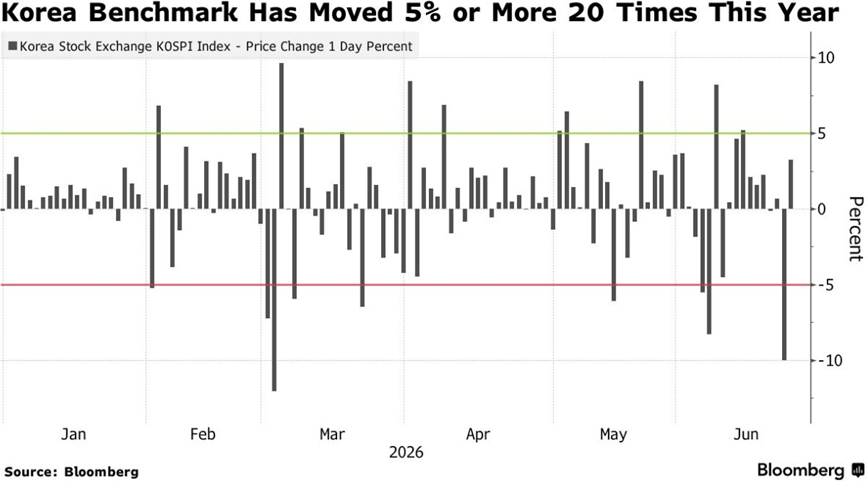
South Korea's benchmark KOSPI suffered its steepest one-day drop on record on Tuesday, closing at 8,203.84 — down 910.71 points, or -9.99% — just one session after hitting an all-time high. A circuit breaker halted trading for 20 minutes after the index fell more than 8% from the prior close.
The collapse was driven almost entirely by the semiconductor complex. Samsung Electronics fell -12.31% and SK hynix dropped -12.47%. The top four chip names account for roughly 61.7% of the KOSPI — an extreme concentration that amplified the correction.
Leveraged ETF unwind, regulatory warnings on single-stock leveraged products, foreign selling of 8.7 trillion won and spillover from Wall Street all converged. The KOSPI had risen more than 90% year-to-date before the crash. On Wednesday, the index staged a partial recovery, closing +3.26% at 8,471.02, helped by reports of a potential 90 trillion won Samsung buyback.
KOSPI — record crash and partial rebound, June 23–24, 2026. Source: Bloomberg.com
Markets prepare for PCE inflation on Thursday
The Nasdaq Composite fell -1.32% on Monday and a further -2.21% on Tuesday — it was the worst day in about two weeks — while the S&P 500 fell -1.44%. The selling was concentrated in semiconductor and AI infrastructure names, with a US semiconductor gauge losing approximately 8% on Tuesday.
Despite Monday's slide, the Nasdaq still holds ahead of US PCE publication on Thursday.
Gold was affected, probably, the worst out of this meltdown, having reached the $4000 price area during Tuesday’s action. The hawkish Fed’s repricing, higher Treasury yields and a stronger US dollar make Gold vulnerable in today’s market conditions.
Brent crude also eased below $77 as Hormuz traffic normalised following an interim US–Iran agreement.
News in focus this week
- Thursday, June 26: US Core PCE (May) — critical inflation gauge; Final GDP (Q1).
- Friday, June 27: US Michigan Consumer Sentiment (Jun, final).
- Ongoing: Samsung share buyback announcement — potential stabiliser for KOSPI.
Now let's shift to potential scenarios and trading ideas for the week ahead, covering the aftermath of the global AI selloff and the key levels to watch in gold and equities.
XAU/USD
Gold confirms the downswing has declined towards the $4000 price area. Following a heavy sell-off, it might likely expand the decline towards 3900 - 3950 price area, testing it for possible responsive buying.
All that happens in response to aggressive cuts to gold price forecasts by major institutions like Deutsche Bank and Goldman Sachs towards 4900. Market bulls have grown notably dispirited, forcing a sharp reality check on the previously highly ambitious 5400-5500 targets.
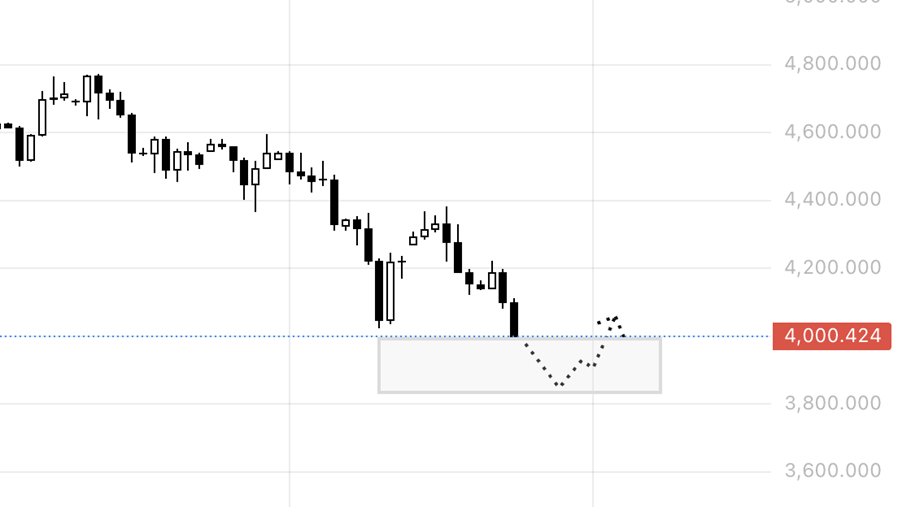
XAUUSD, D1. Source: Exness.com
USOil
Crude oil continues to slide after the US-Iran agreement, whereas the potential for a further decline might be limited, as the price had already surpassed the 200-day moving average: a strategic level of support which may cause the rotation around the current level.
The level of $80 is also considered as a fair price according to supply and demand projection from eia.gov. It’s incredibly difficult to predict the exact dip, but there’s increasing odds that the price will retrace from current levels and start rotating around the 200-day moving average.
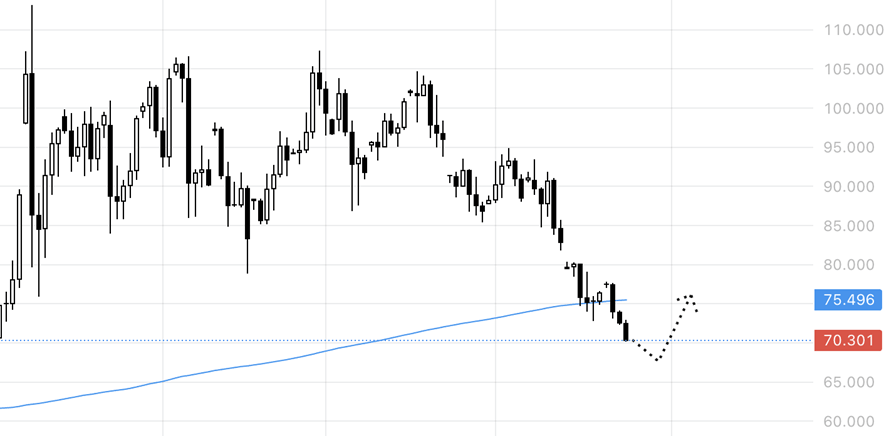
USOIL, D1. Source: Exness.com
Author

Stanislav Bernukhov
Exness
Born in 1980, Stanislav graduated from the university in 2003. He worked in the music industry and ran his own business ventures before being introduced to trading in 2004.


