Warsh, EUR, Burnham – USD buyers remain in control

New Fed chairs like to sound hawkish
October 3, 2018, a new Fed Chair (Powell) got too hawkish, saying "we are a long way from neutral" and everything blew up. Real rates went to 2% and stocks cratered.
Now, a new Fed Chair (Warsh) got super hawkish, and real rates are up around 2% again. Stocks are not liking it for now. But the real takeaway (for me) is that 2-year yields peaked November 9, 2018, as tightening financial conditions turned everything around in a month. Here is a chart of 2s at that time.
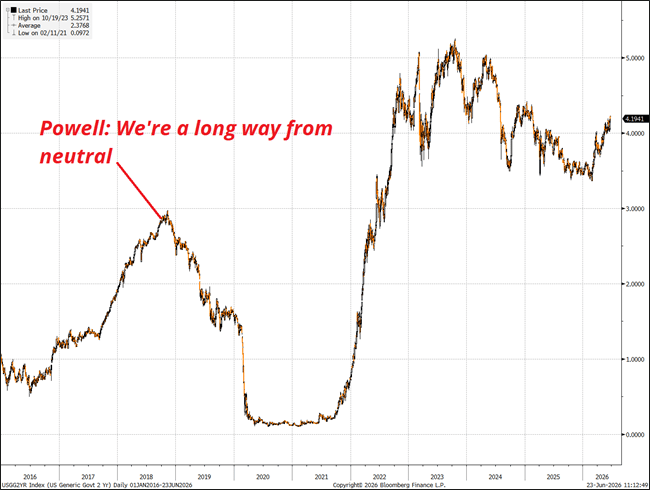
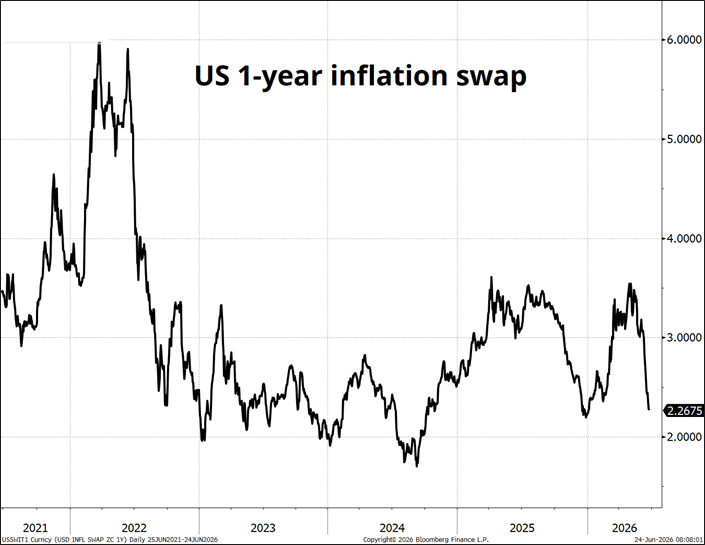
As I have been writing, I think Warsh’s opening hawkish gambit is partly performative and the bar for him to flip less hawkish is snake-belly low. We are probably close to a peak in 2-year yields as the market is max short 2's and Warsh went Barry berserk in a bid for credibility on day one. Inflation is going to come down as oil and other commodities fall and financial conditions tighten.
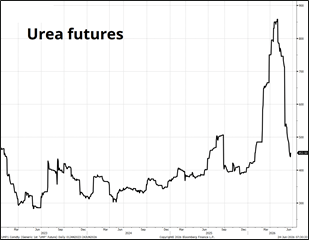
The great fertilizer panic of 2026 is over. The nearly impossible to believe reality is that the Strait of Hormuz closed for almost four months—an absolute worst-case scenario according to most analysts—and yet nothing happened. Oil was $70 in January and now it’s $75. Corn prices are lower. Fertilizer is unchanged. Crazy.
Long 2s or long call spreads in 2-year futures are good trades as a September hike is almost fully priced and I think it should be closer to 40/60. July is 35% and I think it should be 10%. The inflation scare is over, and the data will catch up. Sure, AI capex and other stuff can be inflationary, but energy and commodities dominate.
For now, the dollar continues to rage higher as rate differentials help, gold crumbles, and corporate USD demand is tough to satisfy as they often like to leave bids, and those USD bids are going unfilled. You can see that EURUSD is following rate diffs as they breach the lows made during the post-election euphoria when everyone thought that the Red Sweep would be bullish USD.
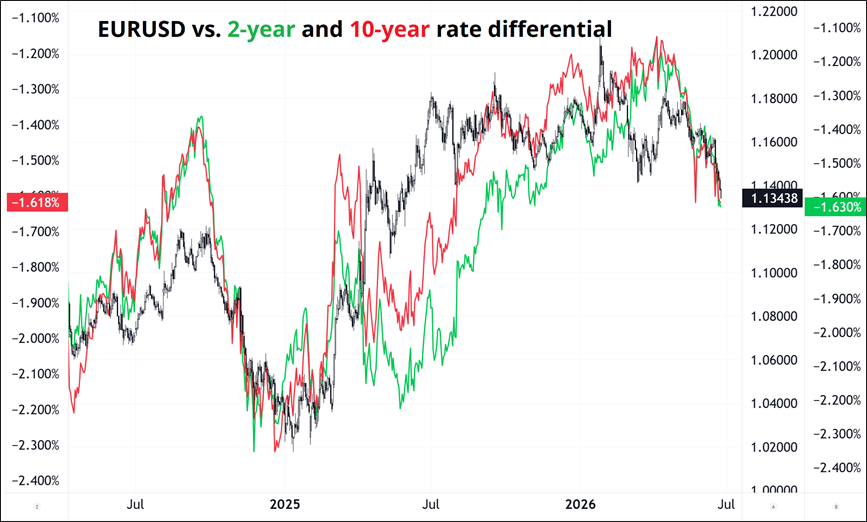
Bigger picture, further USD gains will require further drops in rate differentials, but in the short-term the corporates need dollars and will keep needing dollars for a few more days. My view is that this is creating a USD-positive feedback loop where specs are adding and techs are breaking (1.14 was a big level) and that feedback loop will probably burn itself out soon. The textbook setup would be a strong Core PCE that triggers one last flurry of panic USD buying and then everyone realizes that the data point is backward looking and meaningless and that’s your USD high print. Let’s see.
Overall, US real rates at 2% are high. It will be hard for them to go higher. At some point soon, I will look to fade USDCHF, USDCAD, and GBPUSD and I already have the USDJPY offers in, hoping there’s one last push towards 162.00. Speaking of GBPUSD: Here are the latest odds for Chancellor in the UK.
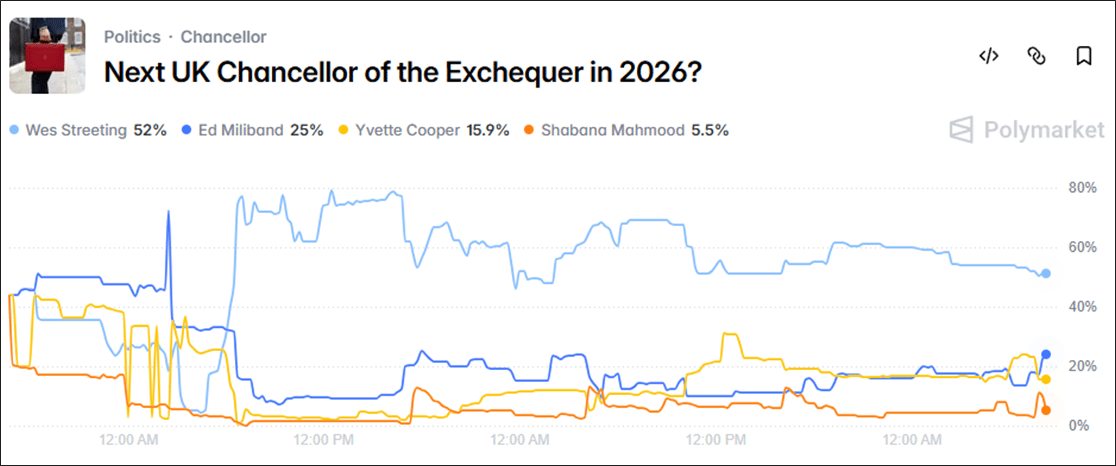
The simple read on any announcement is: Streeting good, Miliband bad, Cooper somewhere in between. The speculation is around whether he keeps a continuity Treasury line or appoints someone like Ed Miliband, which would be read as more left/fiscal-risky by markets. The likely timing of an announcement is July 17, assuming Burnham is confirmed unopposed as Labour leader/PM at the special conference that day. The Guardian reports Burnham would become PM on 17 July, and cabinet appointments would normally follow that same day or very soon after. He could, of course, leak the treasury pick earlier.
MU
The market is getting antsy about the parabolic runs in memory stocks as yesterday’s rinse shows. Regulators are also getting worried as there’s now around $50B of leveraged money chasing three or four memory stocks via levered ETFs.
South Korea Watchdog regrets rushed launch of leveraged ETFs.
My guess is that we are setting up for one of those: The stock sells off no matter what the numbers situations because it is never really about the earnings themselves but about the sustainability of those earnings.
And people are starting to get worried that the parabolic explosion in earnings is getting out of hand and the parabolic rise in the stocks is being fed by various sources of leverage. Furthermore, despite its incredible rise, MU hasn’t traded great on earnings—earnings have been a time for momentum traders to TP, not add. See chart.
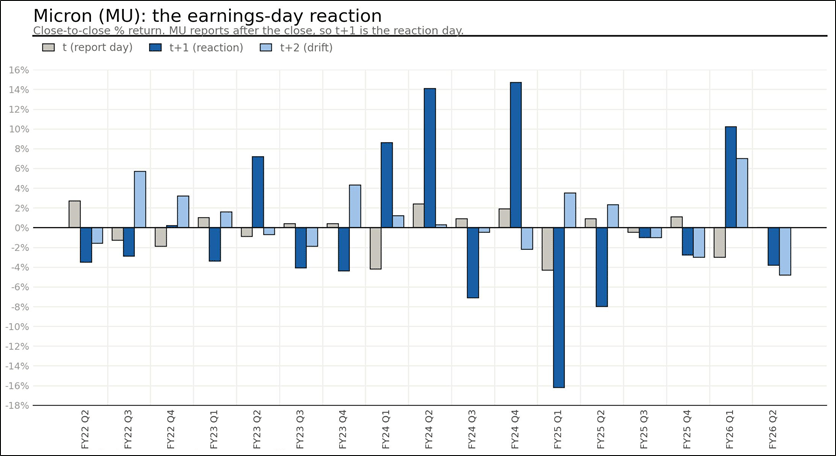
The dark blue lines are the earnings reactions. Light blue is the next day after that. Gray is the day of earnings (i.e., before the numbers come out—today in this case). Given the options market is pricing a 13.6% move (!), you can feasibly sell stock and sell Friday puts if you have a way to risk manage the short. The biggest risk if you’re short is they announce a massive deal with a hyperscaler.
Author

Brent Donnelly
Spectra Markets
Brent Donnelly is the President of Spectra Markets. He has been trading currencies since 1995 and writing about macro since 2004. Brent is the author of “Alpha Trader” (2021) and “The Art of Currency Trading” (Wiley, 2019).















