Markets Dip on NAFTA News
US Dollar: Mar. USD is Up at 92.255.
Energies: Feb ’18 Crude is Up at 63.58.
Financials: The Mar 30 year bond is Up 4 ticks and trading at 150.06.
Indices: The Mar S&P 500 emini ES contract is 10 ticks Higher and trading at 2753.00.
Gold: The Feb gold contract is trading Down at 1317.90. Gold is 14 ticks Lower than its close.
Initial Conclusion
This is not a correlated market. The dollar is Up+ and Crude is Up+ which is not normal and the 30 year Bond is trading Higher. The Financials should always correlate with the US dollar such that if the dollar is lower then bonds should follow and vice-versa. The S&P is Higher and Crude is trading Up+ which is not correlated. Gold is trading Down- which is correlated with the US dollar trading Up+. I tend to believe that Gold has an inverse relationship with the US Dollar as when the US Dollar is down, Gold tends to rise in value and vice-versa. Think of it as a seesaw, when one is up the other should be down. I point this out to you to make you aware that when we don’t have a correlated market, it means something is wrong. As traders you need to be aware of this and proceed with your eyes wide open.
At this hour Asia is trading Mixed with half the exchanges Higher and the other half Lower. As of this writing all of Europe is trading Mixed as well.
Possible Challenges To Traders Today
-
PPI m/m is out at 8:30 AM. This is major.
-
Core PPI m/m is out at 8:30 AM EST. This is major.
-
Unemployment Claims is out at 8:30 AM EST. This is major.
-
IBD/TIPP Economic Optimism. This is major.
-
Natural Gas Storage is out at 10:30 AM EST. This is major.
-
30-y Bond Auction starts at 1 PM EST.
-
Federal Budget Balance is out at 2 PM EST. This is major.
-
FOMC Member Dudley Speaks at 3:30 PM. This is major.
Treasuries
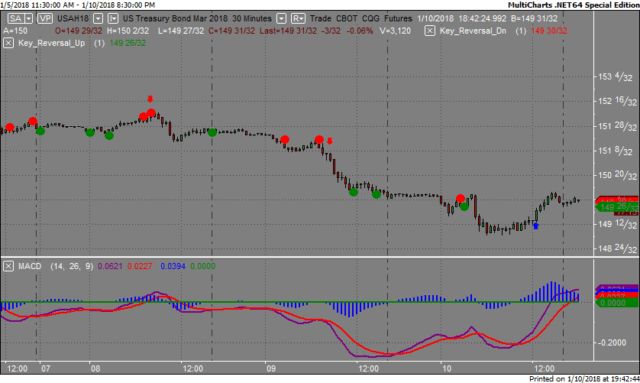
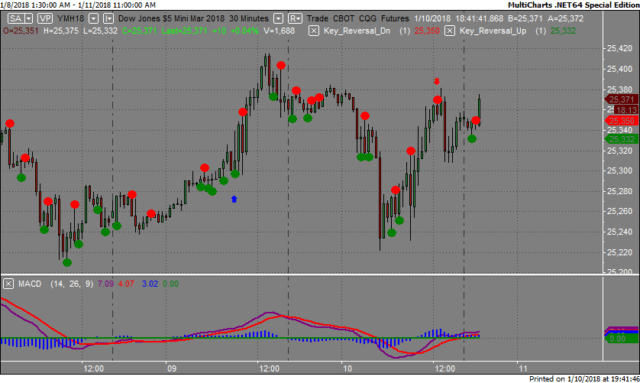
We’ve elected to switch gears a bit and show correlation between the 30 year bond (ZB) and The YM futures contract. The YM contract is the DJIA and the purpose is to show reverse correlation between the two instruments. Remember it’s liken to a seesaw, when up goes up the other should go down and vice versa.
Yesterday the ZB made it’s move at around 12:30 PM EST. The ZB hit a Low at around that time and the YM hit a High. If you look at the charts below ZB gave a signal at around 12:30 PM EST and the YM was moving Lower at the same time. Look at the charts below and you’ll see a pattern for both assets. ZB hit a Low at around 12:30 PM and the YM hit a High. These charts represent the newest version of MultiCharts and I’ve changed the timeframe to a 30 minute chart to display better. This represented a shorting opportunity on the 30 year bond, as a trader you could have netted 20 plus ticks per contract on this trade. Each tick is worth $31.25.
Charts Courtesy of MultiCharts built on an AMP platform.
Bias
Yesterday we gave the markets a Neutral as the futures didn’t seem to have any sense of direction hence the neutral bias. The Dow dropped 17 points and the other indices lost ground as well. Today we aren’t dealing with a correlated market and will maintain a Neutral bias.
Could this change? Of Course. Remember anything can happen in a volatile market.
Commentary
Yesterday we gave the markets a neutral bias because we didn’t see any correlation amongst the various instruments we track. The markets started lower, went higher into positive territory and then dropped into closing. Of course hearing the news that President Trump maybe dropping out of NAFTA didn’t exactly help matters much. On the surface I would have to agree that NAFTA is a travesty that has not served the American people well. But many corporations depend on the free trade agreement for earnings, etc and not having won’t serve them well either. Could Trump have chosen another way? Of course but for him not to do what he did only means it wouldn’t be Trump doing it.
Author

Nick Mastrandrea
Market Tea Leaves


