Markets circumspect with central banks increasingly cautious

Market Overview
Despite the enthusiasm that has come with the S&P 500 and NASDAQ closing back at all-time highs, the outlook for the global economy still looks wobbly. The Eurozone recovery looks tentative at best, and is showing signs of faltering. German Ifo data disappointed on all accounts and shows that global trade is weighing down economic prospects. The disappointment of South Korean growth data overnight, once more plays into this narrative. Central banks are falling over themselves to be more dovish. The Bank of Canada struck a very cautious tone in its policy statement yesterday, citing growth concerns, weaker housing and consumption. Overnight, the Bank of Japan monetary policy kept the deposit rate at -0.1% (-0.1% exp, -0.1% last), but also pledged to keep rates on hold for at least another year. Although the US dollar has been strong, it comes as Treasury yields have been falling, whilst the yen is still holding up relatively well. There is also signs of support growing for gold (although still likely near term). This points to a shift back towards more safer ends of the market. There seems to be a lot baked into the run higher on equities now. Quite whether the S&P 500 can sustain a move into new high ground is questionable. US earnings will need to continue to beat expectations at their current rate, which is around 78%, which against a long run average of around 72%, could be a tall order.
Wall Street closed slightly weaker, with the S&P 500 -0.2% lower at 2927. US futures have found a degree of support +0.2% currently. Asian markets have been mixed, with the Nikkei +0.6% and Shanghai Composite -0.9%. In Europe there is a fairly stable look to early moves with FTSE futures and DAX futures both around +0.2%. In forex, the recent run of USD strength is just being pared slightly across the majors, with JPY outperforming despite the dovish guidance from the BoJ overnight. In commodities, the basis of consolidation is building for gold again, whilst oil is also now consolidating after yesterday’s increase in EIA crude inventories.
After a quiet European morning on the economic calendar, the big focus today will come from the US data. Will the core Durable Goods Orders at 1330BST continue the run of data outperformance for March. This is the final piece of major data prior to the first look at Q1 growth. Consensus estimates put ex-transport Durable Goods at +0.2% for the month of March (after falling by -0.1% in February). The US Weekly Jobless Claims at 1330BST are expected to tick back higher to 200,000 from the record 49 year low of 192,000 last week.
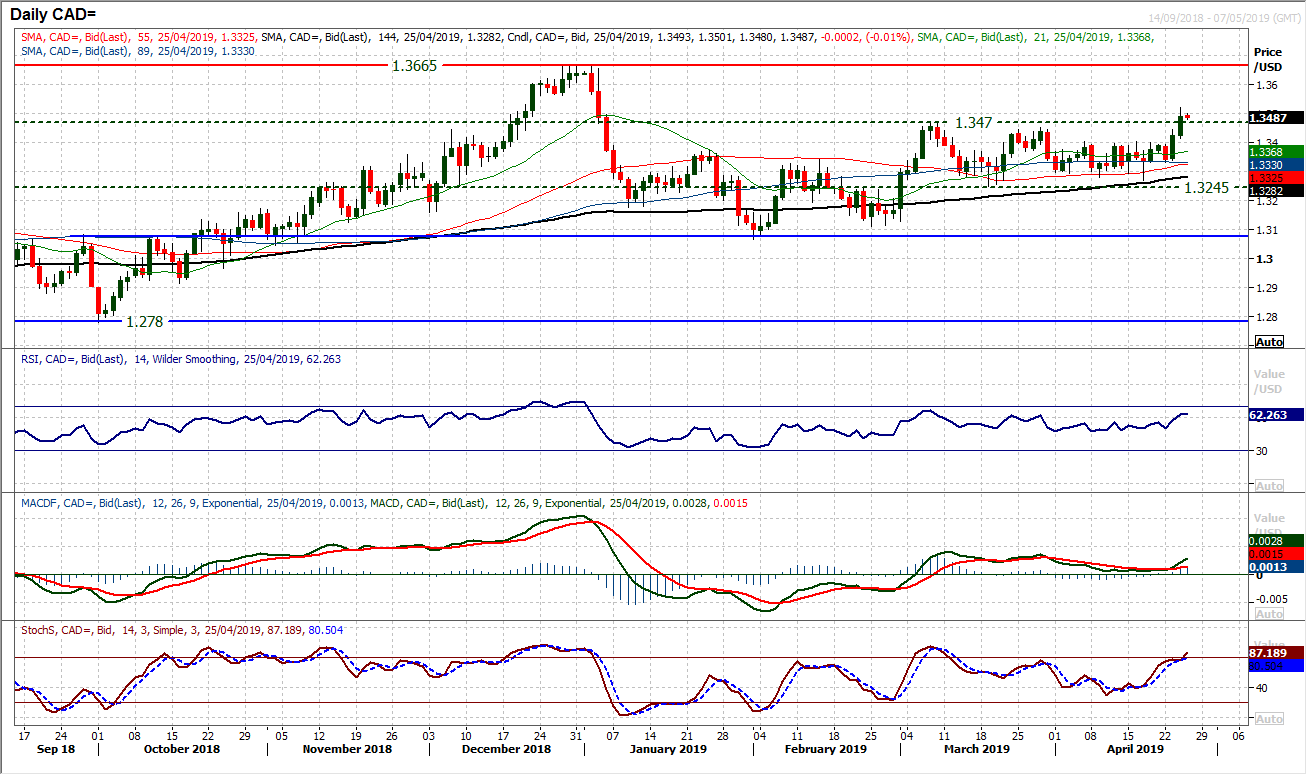
Chart of the Day – USD/CAD
After the cautious lean from the Bank of Canada, the Canadian dollar has come under selling pressure. The move has driven USD/CAD through key resistance at 1.3470 to a new four month high. The move effectively is a breakout of a 180 pip seven week trading range. Which implies 1.3650 in the coming weeks. There is now an open run towards the key December high of 1.3665 which all but coincides with the range breakout target. Momentum indicators have been consolidating for several weeks now but certainly reacted positively to the breakout. The RSI is rising back above 60 at six week highs, whilst the MACD lines have bull crossed higher. Near term corrective moves should now be seen as a chance to buy, with the breakout at 1.3470 initial support. There is a band of highs between 1.3450/1.3470 over the past seven weeks which should be seen as a buy zone. The hourly chart shows a further breakout above 1.3400 is a further basis of support that the bulls would not want to breach.
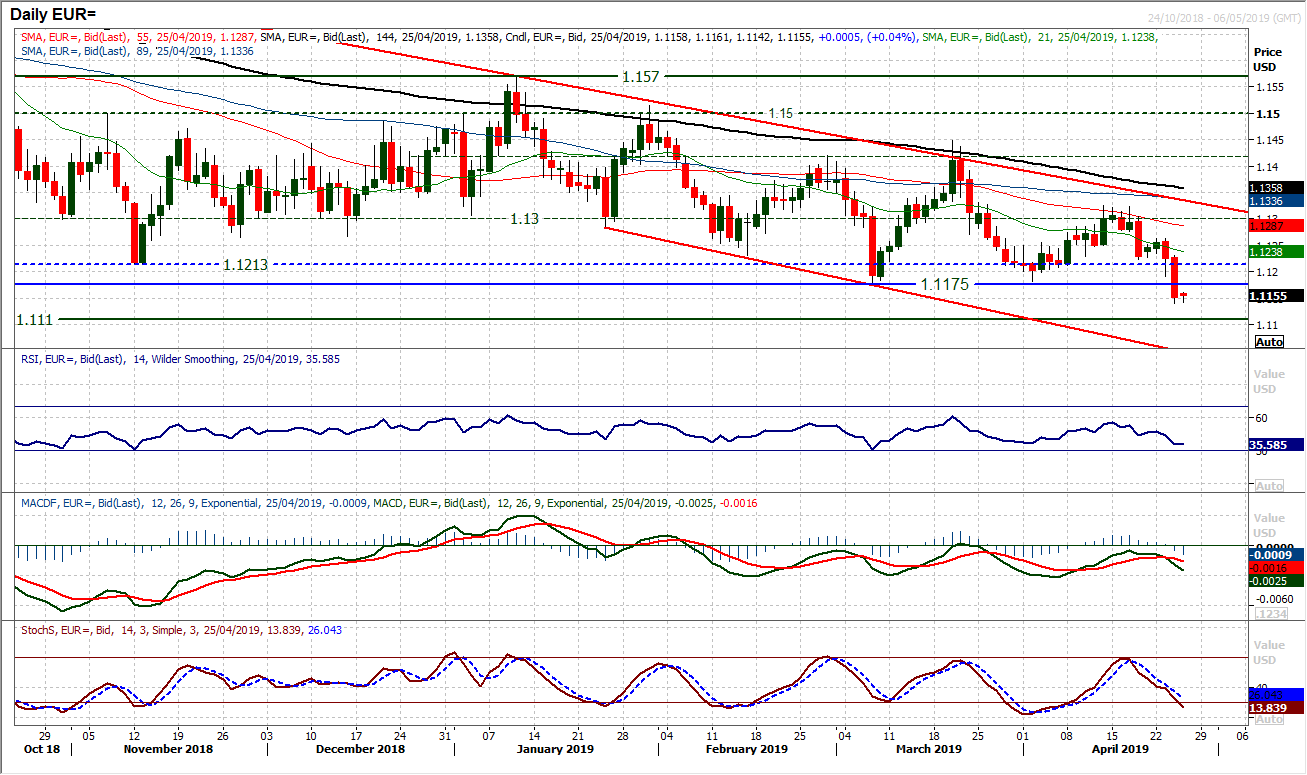
After the Easter break we were looking to see the reaction to the deteriorating outlook. The response has been fairly emphatic. There has been a decisive downside break on EUR/USD below $1.1175 to a new low dating back to June 2017. This continues the move lower and opens $1.1100 initially, whilst a move to $1.1000 should not be ruled out now. Momentum configuration is decisively negative once more, with the bear cross on MACD, Stochastics accelerating lower and RSI in the mid-30s. There is also downside potential on the current move. We often discuss the directional moves lasting around two weeks on EUR/USD, so being just a week into the current move lower, there is also further downside potential on that front too. The old support band $1.1175/$1.1210 is now a basis of overhead supply for any intraday/near term technical rallies. Resistance at $1.1260 is a lower high. The hourly chart shows negative configuration and that any unwind is a chance to sell now.
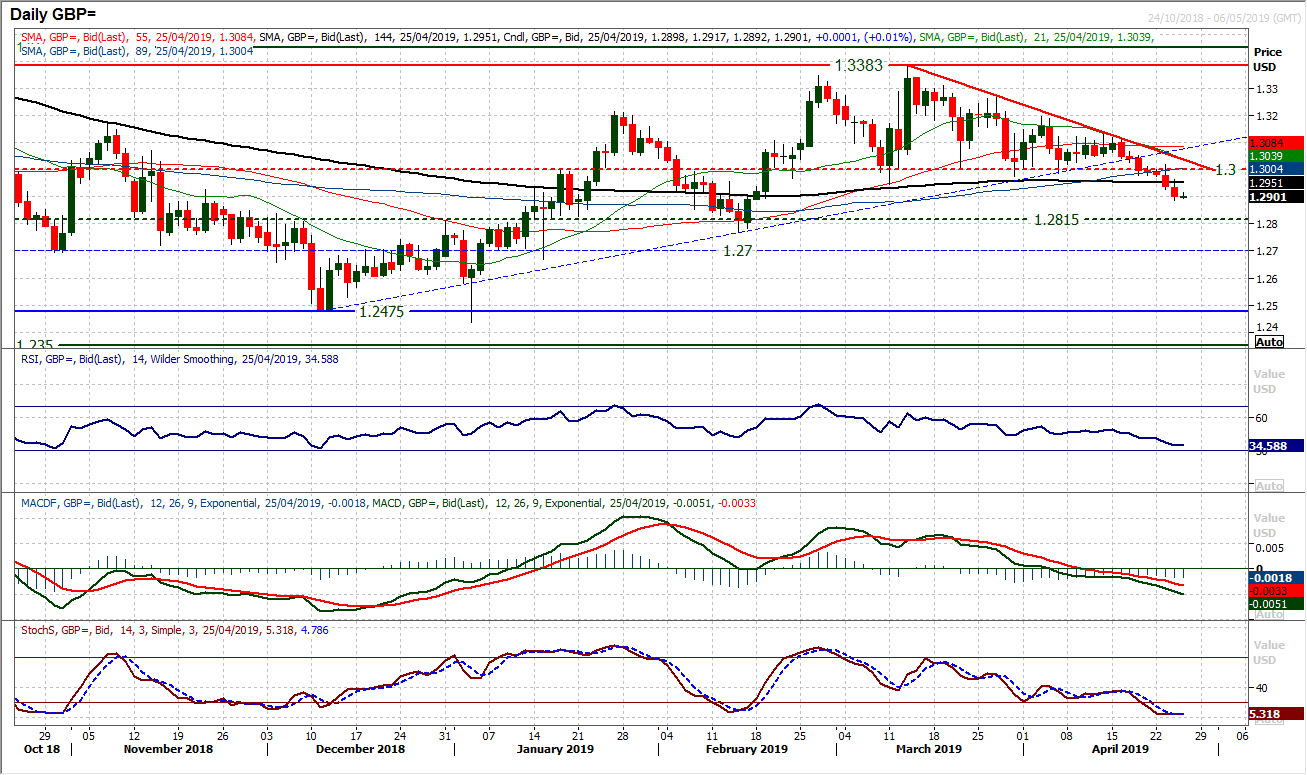
The dollar is making key breaks across the major pairs. Cable is another to decisively break lower in recent sessions. A move of seven consecutive negative candlesticks have come as the market has broken below the old key floor at $1.3000 to open a new phase of corrective outlook. A six week downtrend which is at $1.3035 today reflects this. Momentum indicators are now decisively negatively configured on a medium term basis. This implies that near term technical rallies should be seen as a chance to sell. The RSI is in the mid-30s, the lowest since December, whilst MACD lines fall below neutral for the first time in several months. The old floor becomes a key basis of resistance now around $1.3000. Having made the downside break, an old pivot around $1.2815 comes into play, with the February low at $1.2770.
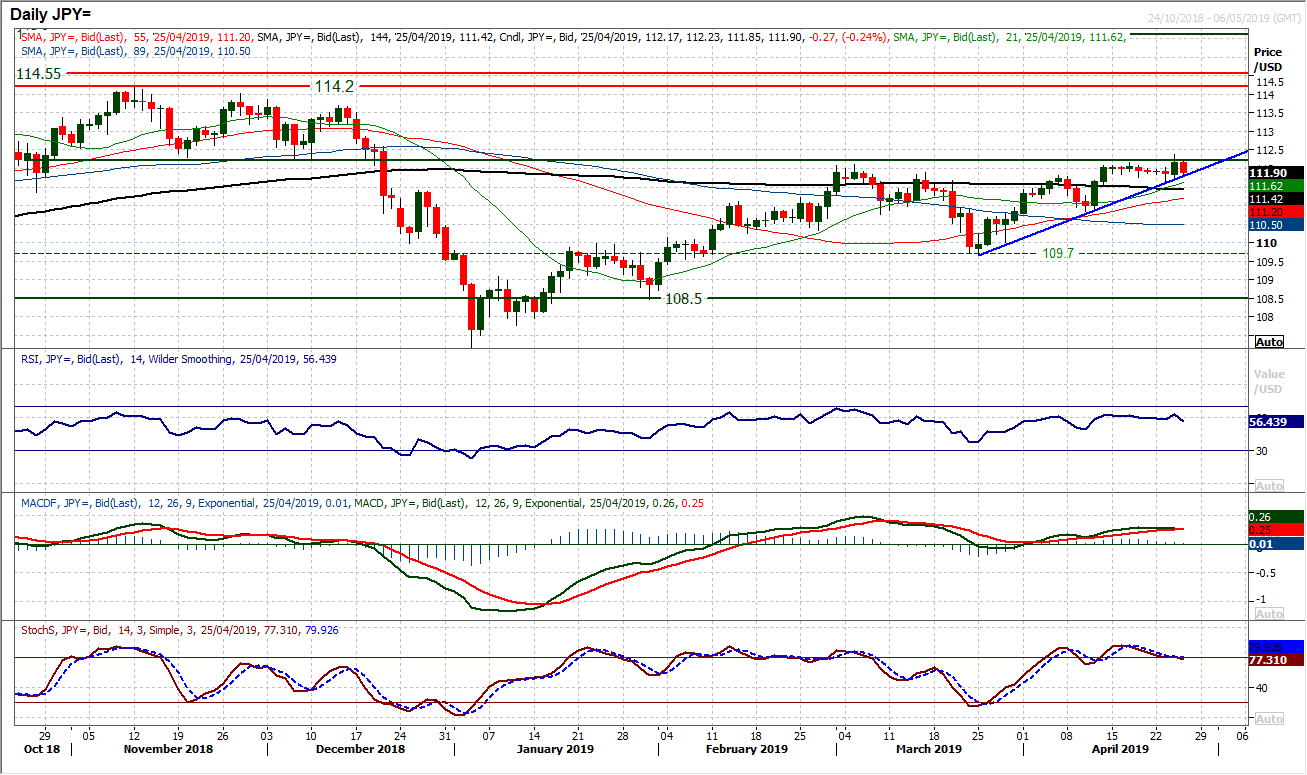
With the dollar making ground across the majors, are we finally seeing a similar move against the yen? Yesterday’s move above 112.20 was encouraging, but by no means decisive. Especially considering the early move back lower this morning. It does seem as though the dollar bulls are champing at the bit, but have not been released quite yet. The trend higher of the past four weeks is a basis of support at 111.80 today as the squeeze higher has come. The recent consolidation low at 111.65 will be watched as a closing gauge for the next move. Momentum is still drifting slightly, but in a positive configuration. The expectation remains that the next move will be an upside break, but the bulls are being restrained. A decisive close above 112.20 and continuation of the trend would open the upside towards the November/December resistance. Highs of 113.70/114.20/114.55 come into play. The hourly chart shows below 111.60 would limit the upside impetus, with further pivot support at 111.20. A move below 110.85 would neutralise the outlook.
Gold
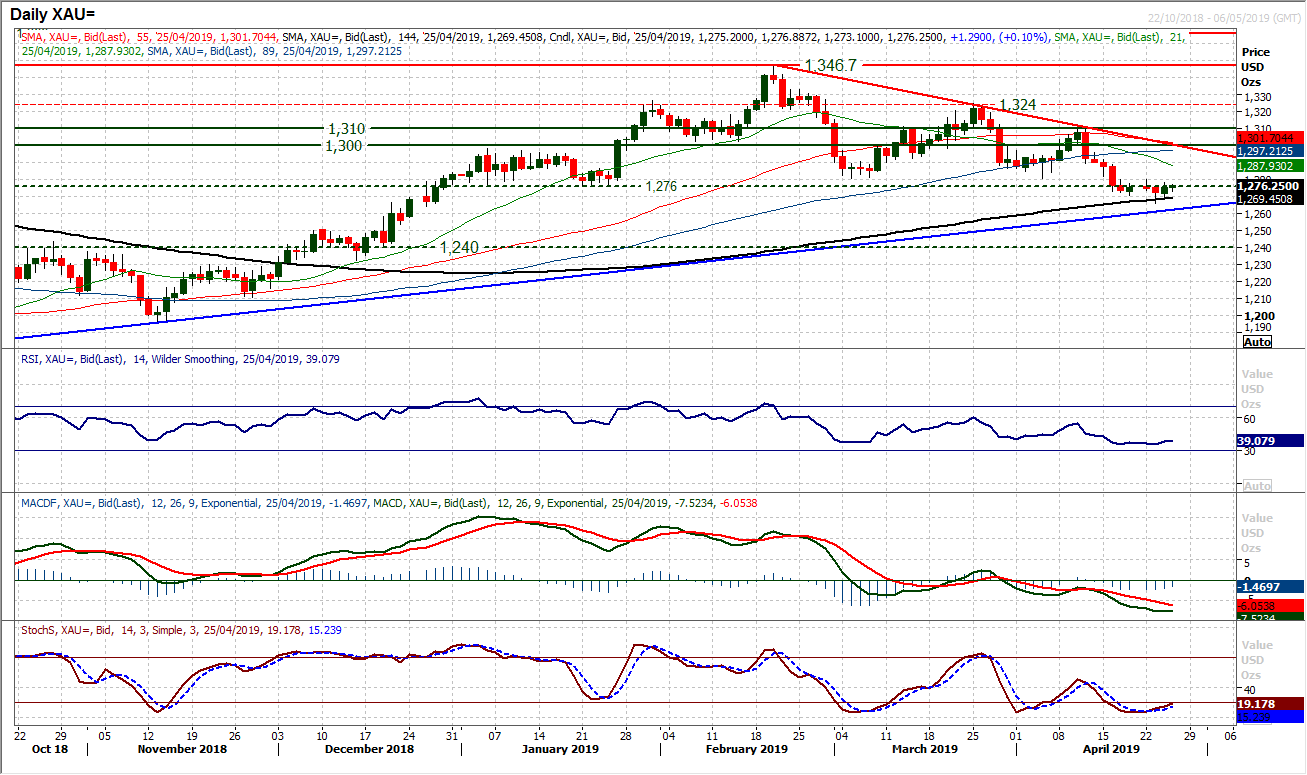
The move lower has found a basis of support in recent sessions around the rising 144 day moving average (today $1269). This means that the final two positive technical arguments remain intact (the other being the eight month uptrend around $1261 today), for now. But for how long? Selling pressure seems to have been contained near term, but this is still likely to be just a consolidation. The resistance band $1276/$1280 remains key overhead supply which is ready to restrict a recovery. However, this band needs to be watched as a break back above could induce a technical rally. The resistance of the nine week downtrend comes in at $1300 today. This increases the technical importance of the long term pivot $1300/$1310. For now the bulls can only hope for an unwinding rally. However, the medium term implications of the break through $1276 are for a move down to $1206 in the coming months. Technical rallies will be seen as a chance to sell until $1310 is broken. Initial support at $1266 from Tuesday’s low and then an old pivot around $1240.
WTI Oil
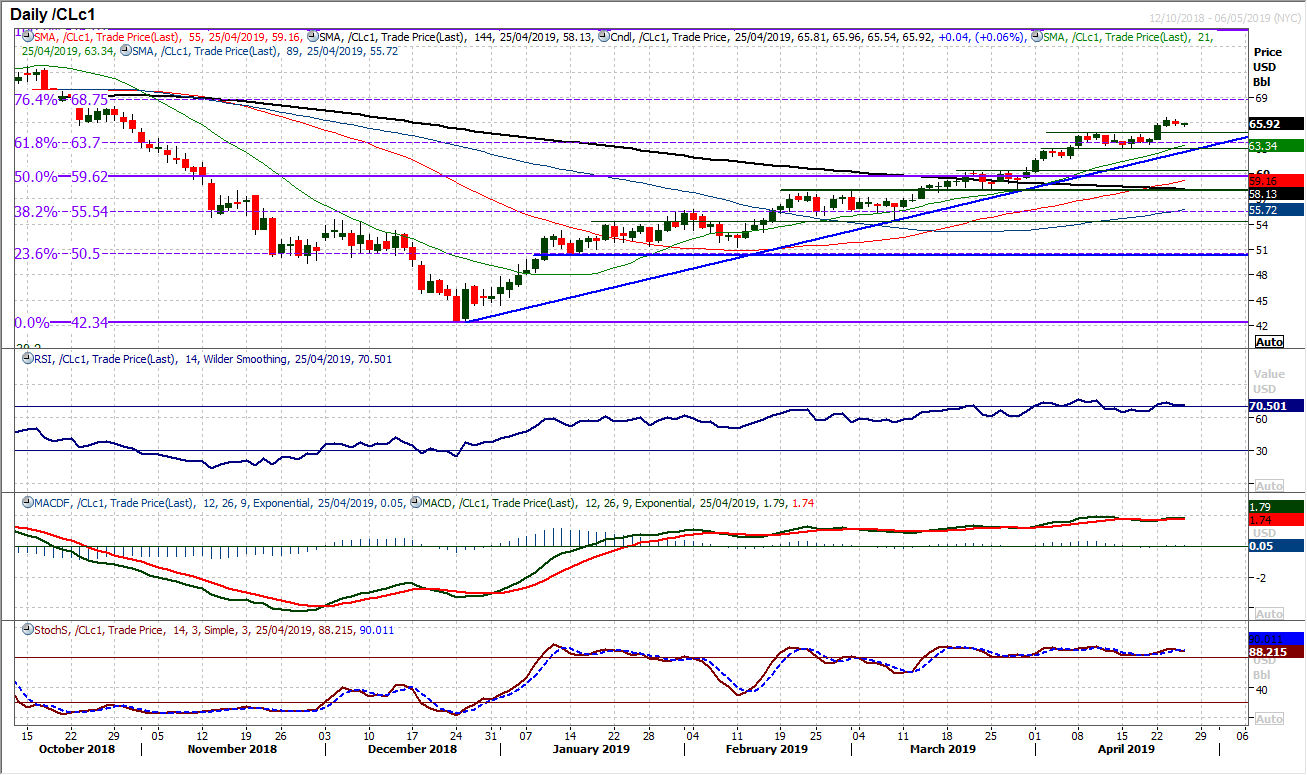
Having broken sharply out above $64.80 the move became stretched and the bulls restricted. On a consistent basis the breakouts have sought support around the old resistance. This means that $64.80 is a prime area of retreat. With the RSI floundering in the mid-70s, upside potential becomes limited and a consolidation has often been the result. Tuesday’s resistance at $66.70 is now in place, but corrections are a chance to buy still. Interestingly the rising 21 day moving average which has flanked the run higher now comes in around $63.15 which is above the $63.00 key floor. Looking to buy into weakness for further moves towards the 76.4% Fibonacci retracement at $68.75.
Dow Jones Industrial Average
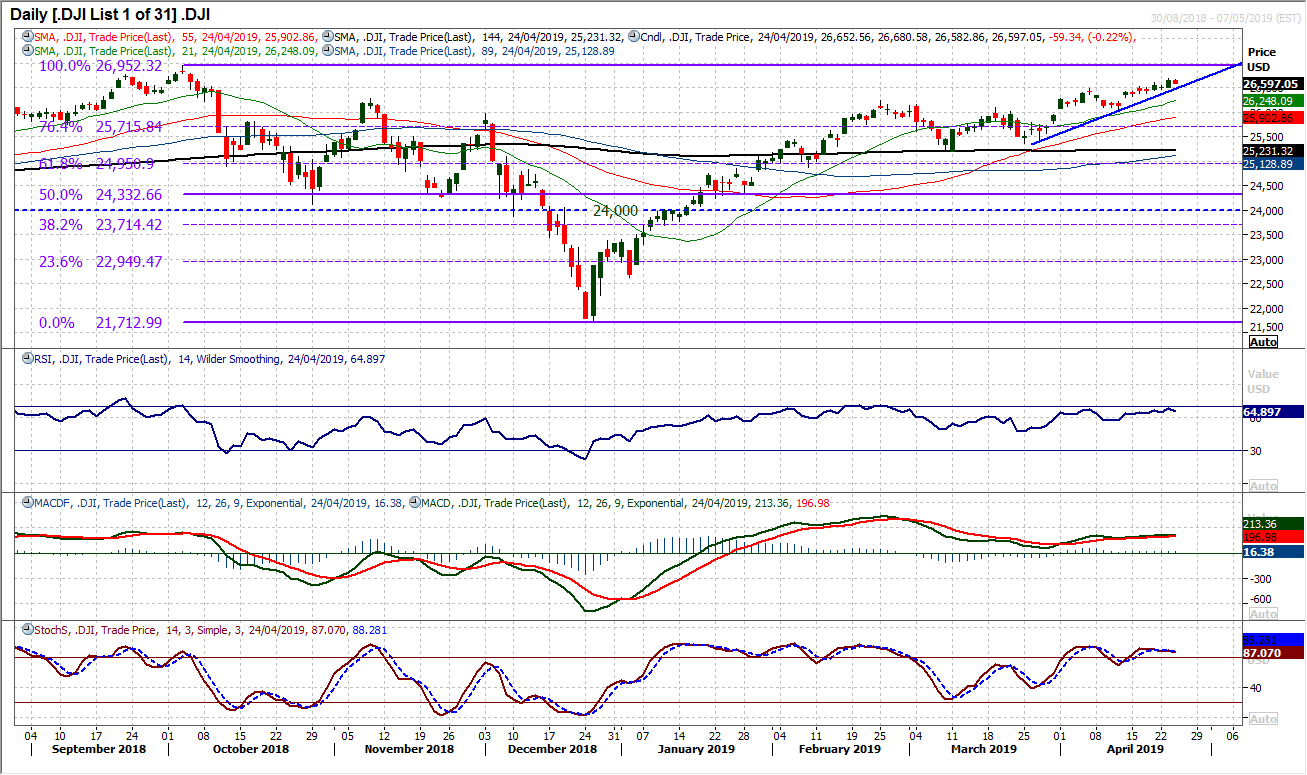
After a strong breakout session on Tuesday, the bulls have just had the reins pulled on the move higher. Despite the S&P 500 previously breaking to new all-time closing highs, the Dow is still some way off (c. 1.5%). However, given the strength of the momentum indicators, there should still be enough to see the 26,952 high tested. For now, the support of the uptrend support at 26,540 needs to be watched. Furthermore, initial support at 26,392 also needs to hold to maintain momentum. Despite this, corrections would remain a chance to buy for the Dow whilst the low at 26,062 remains intact. Initial resistance at 26,695.
Author

Richard Perry
Independent Analyst


