Markets change in a flash

USD: Mar '26 is Down at 97.475.
Energies: Mar '26 Crude is Up at 62.49.
Financials: The Mar '26 30 Year T-Bond is Lower by 10 ticks and trading at 114.10.
Indices: The Mar '26 S&P 500 emini ES contract is 52 ticks Higher and trading at 7015.50
Gold: The Feb'26 Gold contract is trading Up at 4946.90
Initial conclusion
This is not a correlated market. The USD is Down and Crude is Up which is normal, and the 30 Year T-Bond is trading Lower. The Financials should always correlate with the US dollar such that if the dollar is Higher, then the bonds should follow and vice-versa. The S&P is Higher and Crude is trading Lower which is correlated. Gold is trading Higher which is correlated with the US dollar trading Down. I tend to believe that Gold has an inverse relationship with the US Dollar as when the US Dollar is down, Gold tends to rise in value and vice-versa. Think of it as a seesaw, when one is up the other should be down. I point this out to you to make you aware that when we don't have a correlated market, it means something is wrong. As traders you need to be aware of this and proceed with your eyes wide open. All of Asia traded Higher. Currently all of Europe is trading Higher as well.
Possible challenges to traders
- FOMC Member Barkin Speaks at 8 AM EST. This is Major.
- FOMC Member Bowman Speaks at 9:40 AM EST. This is Major.
- Jolts Job Openings is tentative. This is Major.
- RCM/TIPP Economic Optimism is tentative. This is Major.
- Wards Total Vehicle Sales by brand - All Day This is Major.
Traders, please note that we've changed the Bond instrument from the 10 Year (ZN) to the 2 Year (ZT). They work exactly the same.
We've elected to switch gears a bit and show correlation between the 2-year Treasury notes (ZT) and the S&P futures contract. The YM contract is the Dow Jones Industrial Average, and the purpose is to show reverse correlation between the two instruments. Remember it's likened to a seesaw, when up goes up the other should go down and vice versa.
Yesterday the ZT dived Lower at around 8:30 AM EST with no real economic reports. The Dow climbed Higher at around the same time. Look at the charts below and you'll see a pattern for both assets. The ZT dived Lower at around 8:30 AM EST and the Dow climbed Higher at around the same time. These charts represent the newest version of Bar Charts, and I've changed the timeframe to a 15-minute chart to display better. This represented a Short opportunity on the 2-year note, as a trader you could have netted a dozen plus ticks per contract on this trade. Each tick is worth $6.25. Please note: the front month for the ZT and YM are both Mar '26. I've changed the format to filled Candlesticks (not hollow) such that it may be more apparent and visible.
Charts courtesy of BarCharts
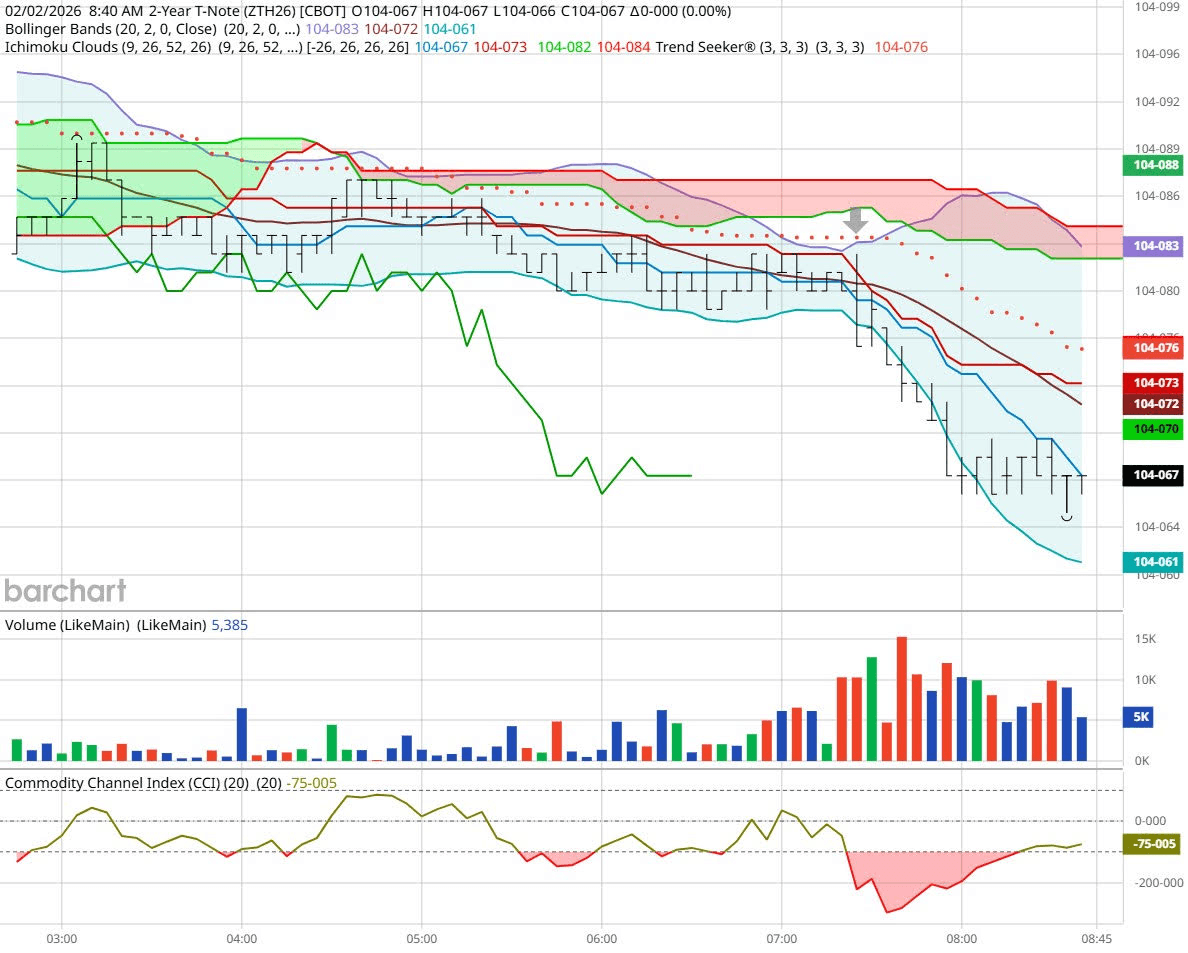
ZT -Mar 26 - 2/02/26
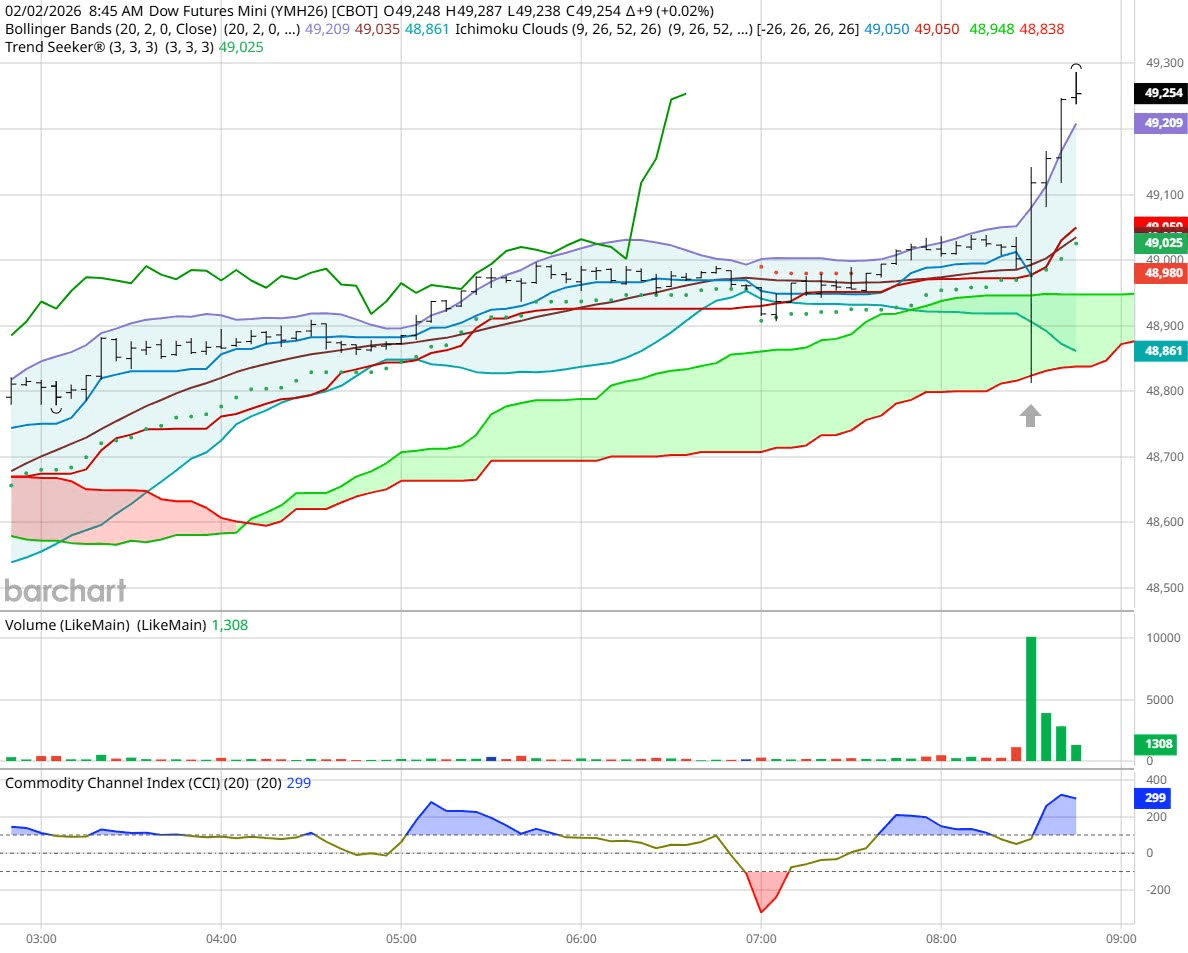
Dow - Mar 2026- 2/02/26
Bias
Yesterday we gave the markets a Downside bias, but the markets had other ideas as the Dow closed Higher by 401 points and the other indices closed Higher as well. Today we are dealing with a nearly correlated market, and our bias is to the Upside.
Could this change? Of Course. Remember anything can happen in a volatile market.
Commentary
Yesterday morning it appeared that the markets would migrate Lower as it was correlated in that direction. The markets decided to flip that and close Higher. Want to learn Market Correlation and determine market direction hours before the Opening Bell?
Author

Nick Mastrandrea
Market Tea Leaves


