Market Update 5/2 - Monthly TLT Buy Signal

TLT MONTHLY
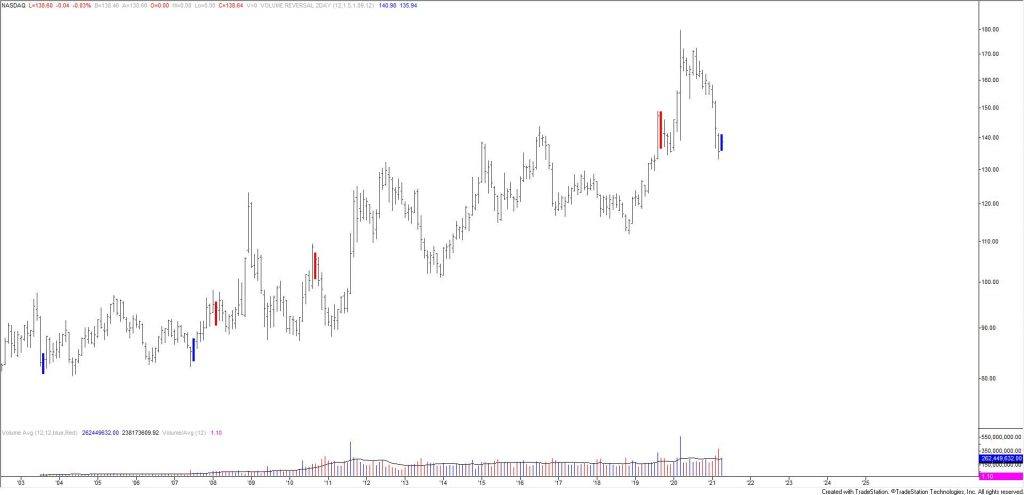
TLT completed a 2 bar monthly volume reversal in April. This is the 3rd bullish monthly signal ever. The first 2 (blue bars) nailed lows in August 2003 and July 2007.
4/5 – TLT has reached initial resistance from the median line and 50 day average. I remain constructive towards 148.90 but some back and fill and/or a pullback here wouldn’t be a surprise. If price breaks above the median line, then the top side of that line becomes proposed support.
USDOLLAR WEEKLY
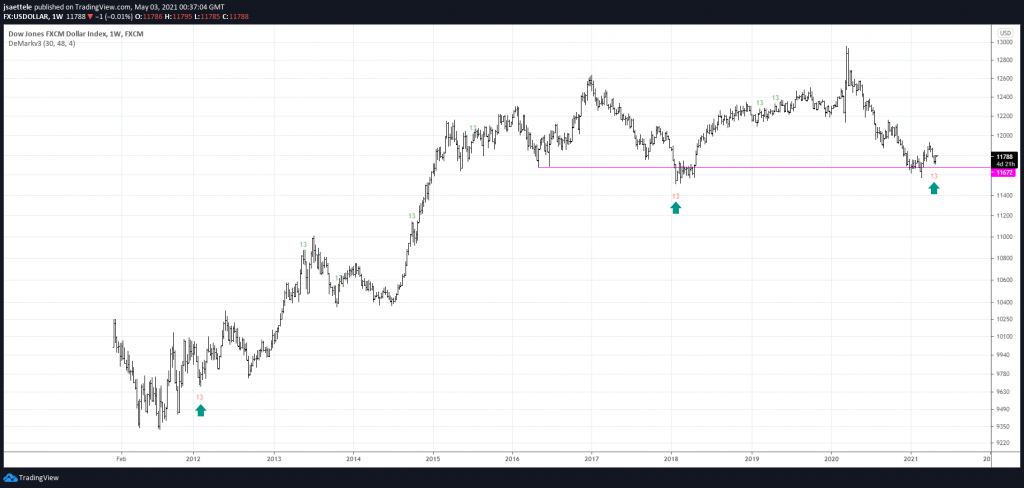
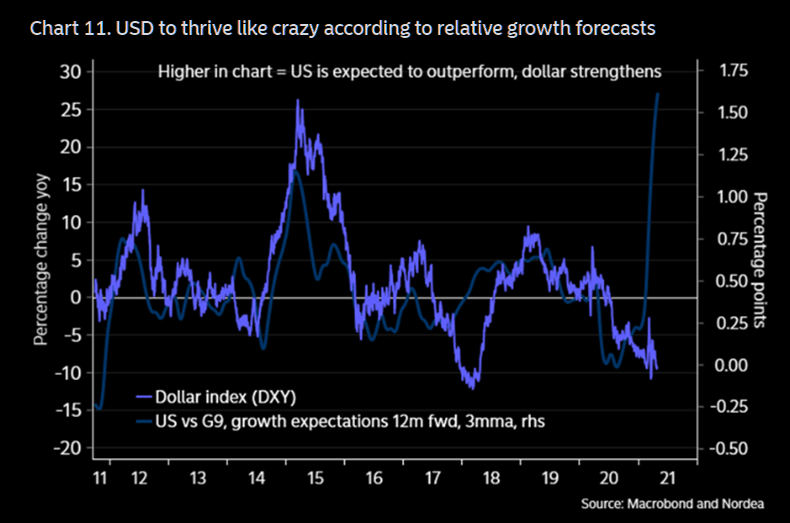
USDOLLAR has completed a DeMark weekly sequential buy countdown. This is the 3rd such bullish signal since inception of the index (which I helped develop). The other 2 signals nails lows in February 2012 and January 2018. Another piece of USD bullish information is shown below. Relative growth forecasts against G9 currencies is extremely bullish for the buck.
4/19 – The sharp USD drop on Monday makes me neutral at best for now. I had wanted to see USDOLLAR hold the median line from the multiyear structure in order to stay constructive (see below). That said, DXY has reached VWAP from the January low and USDOLLAR has reached the 3/18 low. The 61.8% retrace for USDOLLAR is slightly lower at 11705. Keep an eye on these levels for possible support.
USD/JPY 4 HOUR
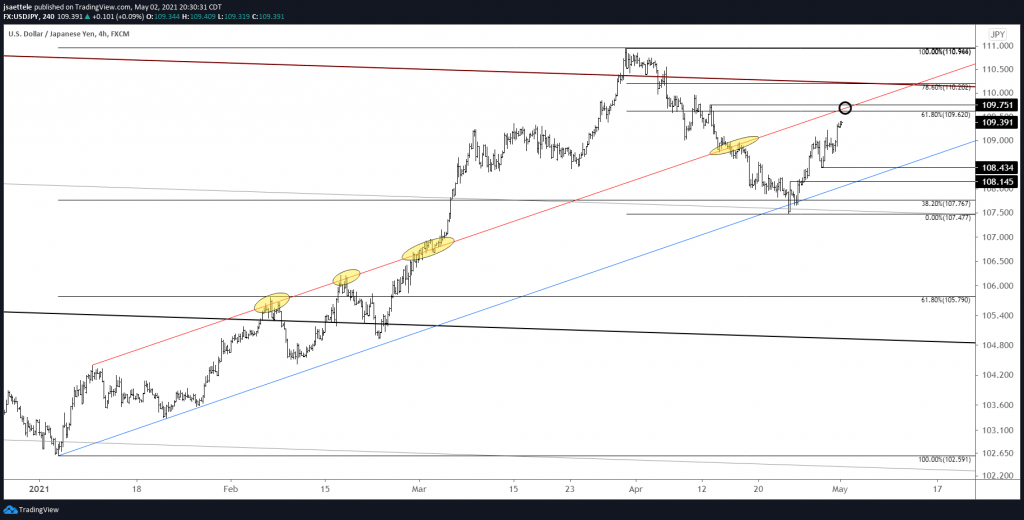
USDJPY strength has extended and is nearing the level that I was originally keeping in mind for resistance. That level is 109.62/75. This is former channel resistance turned resistance turned resistance again, the 61.8% retrace of the drop from 3/31 and the 4/13 high. Trading wise, I prefer EURJPY short (more on that below).
NZD/USD 4 HOUR
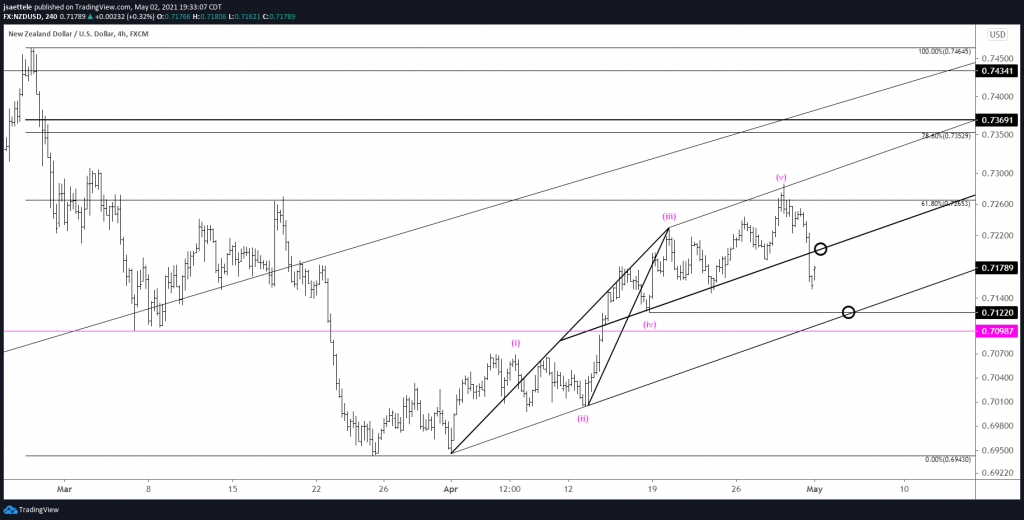
NZDUSD has turned lower as expected and downside focus remains on short term channel support. That is about .7110 on Monday and increases roughly 7 pips per day. .7200 is now proposed resistance.
4/29 – NZDUSD reversed and I favor weakness into the noted .7122 as long as price is below today’s high. The center line at .7195 is a possible bounce level.
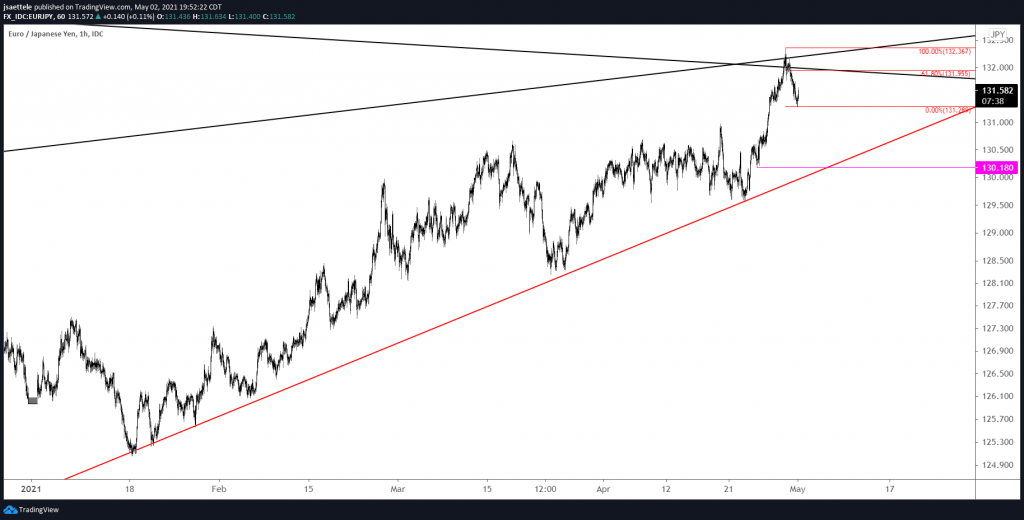
EURJPY turned down on Friday and the drop can be ‘counted’ as impulsive. As such, I favor a small bounce followed by additional weakness. Proposed resistance is 61.8% of the retrace at 131.95. The first downside level of interest is trendline support from the November low. That line is currently near 130.00.
4/29 – EURJPY closed right at 132.00 today. This is HUGE. The level is defined by the underside of the trendline from the 2012 low and the trendline from the 2008 high! If you look at a 4 hour chart, you’ll see a 4 hour reversal candle. This occurred during the active U.S. session so perhaps a top is in place? The big short trigger remains a break of the upward sloping trendline (see red line on 4 hour chart below) but if price drops in a clear 5 waves from today’s high then I’ll plot an entry. Stay tuned.
Author

Scandinavian Markets Research Team
Scandinavian Capital Markets
Scandinavian Capital Markets' Research Team boasts world-renowned, professional market analysts and traders with proven track records in the markets and as business leaders.


