Market shows mixed signals ahead of key CPI data as Fed decision looms
USD: Sept '24 is Down at 101.350.
Energies: Oct '24 Crude is Up at 67.26.
Financials: The Dec '24 30 Year T-Bond is Up 8 ticks and trading at 127.05.
Indices: The Sept '24 S&P 500 emini ES contract is 56 ticks Lower and trading at 5489.75.
Gold: The Dec'24 Gold contract is trading Up at 2550.60.
Initial conclusion
This is not a correlated market. The USD is Down and Crude is Up which is normal, but the 30 Year T-Bond is trading Higher. The Financials should always correlate with the US dollar such that if the dollar is Higher, then the bonds should follow and vice-versa. The S&P is Lower and Crude is trading Higher which is correlated. Gold is trading Higher which is correlated with the US dollar trading Down. I tend to believe that Gold has an inverse relationship with the US Dollar as when the US Dollar is down, Gold tends to rise in value and vice-versa. Think of it as a seesaw, when one is up the other should be down. I point this out to you to make you aware that when we don't have a correlated market, it means something is wrong. As traders you need to be aware of this and proceed with your eyes wide open. Currently all of Asia is trading Lower with the exception of the Singapore exchange which is fractionally Higher. Conversely All of Europe is trading Higher.
Possible challenges to traders
-
Core CPI m/m is out at 8:30 AM EST. This is Major.
-
CPI m/m is out at 8:30 AM EST. This is Major.
-
CPI y/y is out at 8:30 AM. This is Major.
-
Crude Oil Inventories is out at 10:30 AM EST. This is Major.
-
10-y Bond Auction starts at 1 PM EST. This is Major.
Traders, please note that we've changed the Bond instrument from the 10 year (ZN) to the 2 year (ZT). They work exactly the same.
We've elected to switch gears a bit and show correlation between the 2-year Treasury notes (ZT) and the S&P futures contract. The YM contract is the Dow Jones Industrial Average, and the purpose is to show reverse correlation between the two instruments. Remember it's likened to a seesaw, when up goes up the other should go down and vice versa.
Yesterday the ZT migrated Higher at around 8 AM EST with no real economic news to speak of and began its Upward climb. Look at the charts below and you'll see a pattern for both assets. The Dow moved Lower at 8 AM and the ZT moved Higher at around the same time. These charts represent the newest version of Bar Charts, and I've changed the timeframe to a 15-minute chart to display better. This represented a Long opportunity on the 2-year note, as a trader you could have netted about 30 plus ticks per contract on this trade. Each tick is worth $7.625. Please note: the front month for ZT is Dec and the Dow is still Sept '24. I've changed the format to filled Candlesticks (not hollow) such that it may be more apparent and visible.
Charts courtesy of barcharts
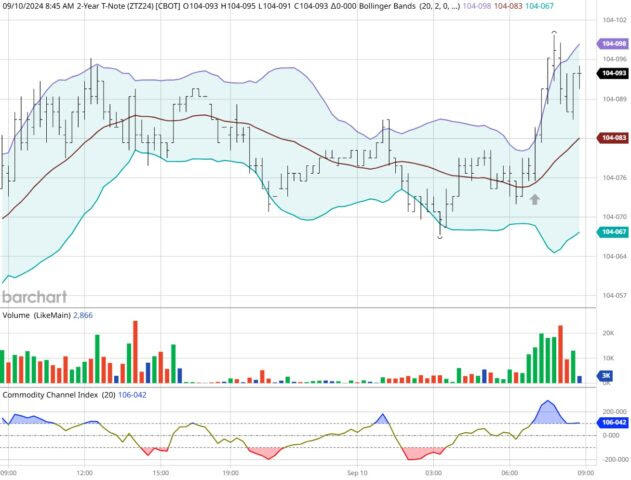
ZT -Dec 2024 - 09/10/24
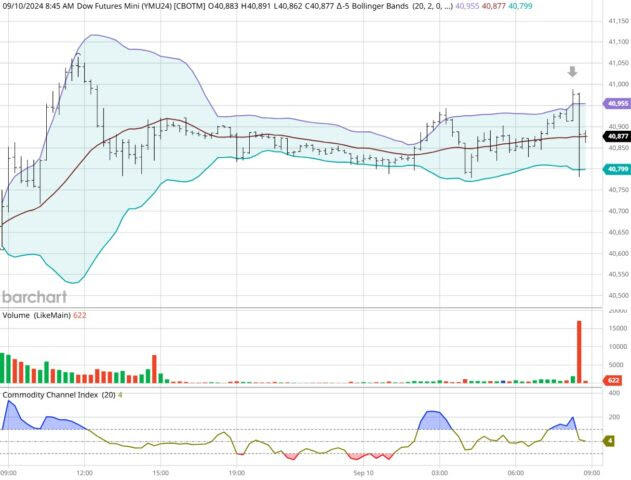
Dow - Sept 2024- 09/10/24
Bias
Yesterday we gave the markets a Neutral or Mixed bias as we saw no real evidence of Market Correlation Tuesday morning. The markets didn't disappoint as the Dow dropped 93 points on the session but the other indices showed gains. Today we aren't dealing with a correlated market and our bias is to the Downside.
Could this change? Of Course. Remember anything can happen in a volatile market.
Commentary
Yesterday we saw no real evidence of Market Correlation and as such claimed a Neutral or Mixed bias for the day. The markets traded accordingly and the Dow dropped 93 points but the other indices did manage to gain on the session. Today we have the all important CPI numbers for the month and the year and can bet that the Federal Reserve will be watching numbers carefully as they do meet next week. Do we think that they will reduce interest rates? There's a very strong case for them doing so but these CPI numbers will no doubt weight into that decision. As in all things, only time will tell.
Author

Nick Mastrandrea
Market Tea Leaves


