Making sense of the short-term SP 500 chop

Even after yesterday's rebound, the S&P keeps trading merely at the early June highs. Is this just a reflexive rebound before the stock upswing rolls over to the downside? I don't think so, and in today's analysis will make the case why another leg higher is still more likely than seeing stocks plunge.
Yes, stocks are taking their time to make the next move. Little wonder given the recent technology trading – rotation can't carry the S&P 500 upswing on its own. But the stock with the greatest weight in the index, Microsoft (MSFT), stood steady again yesterday. Part and parcel of base building in tech before the talk of a bubble arrived in earnest. That's the best the stock bulls can hope for – and based on the semiconductors (XSD ETF) performance, they can indeed more than hope so.
Hope is a double-edged and potentially very dangerous word both in the markets and in life. It's best to see the situation for what it is, free from rose-tinted or black-tinted glasses – which is exactly the way it should be.
Let's take corona deaths as an example. Given the hair-raising headlines, would you expect to find such a daily fatalities chart (courtesy of Lew Rockwell, Vasko Kohlmayer and the worldometers website)?
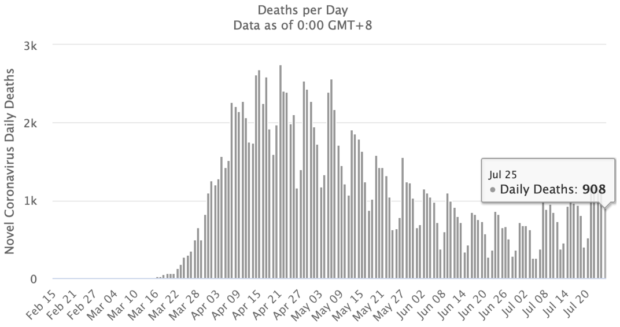
I don't think so. Objective minds and reality still rule, thankfully.
On Thursday, I've laid out the market's sensitivities this way:
(...) as strange as it might sound, the stock market isn't about the real economy struggles these weeks. All eyes are on the stimulus and vaccine hopes (whatever one imagines under the latter term), not on the corona case panic and hyped death charts.
Such were my yesterday's thoughts on the policy measures dynamics:
(...) Stimulus is coming, and regardless of its final shape and size, markets are going to cheer it. The Fed is no longer in a wait-and-see weekly mode. Stocks expect a policy move, and are still positioned to benefit before inflation or economic realities (thornier road ahead than many an alphabet soup recovery projection implies) strike.
SP 500 in the Short-Run
I'll start with the daily chart perspective:
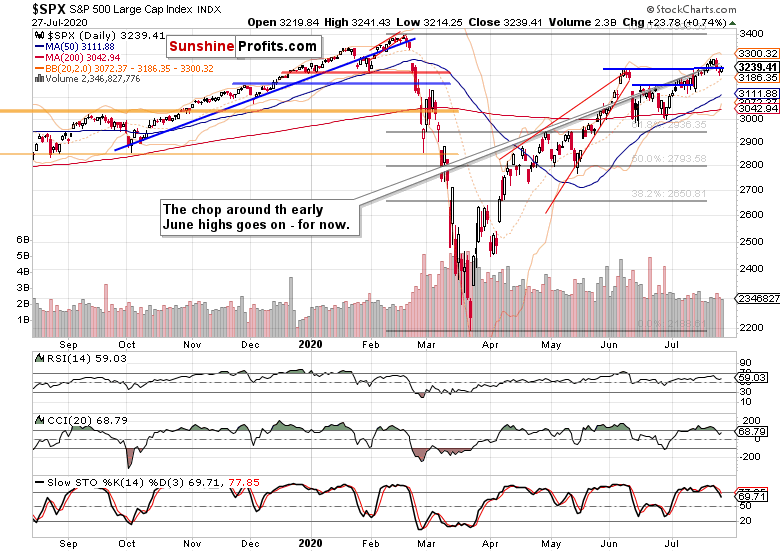
Stocks keep moving around the line connecting the early June highs, and the daily chart is seemingly providing little clarity as to the upcoming move. I understand the price action as a prolonged base building, and look for stocks to make another move to the upside despite the weakening daily indicators.
Their sell signals would imply a downside move, but the price moves aren't mirroring that, and neither the volume supports a reversal hypothesis currently. The lack of a true plunge thus makes the consolidation followed by more upside scenario, the more likely one.
It's also the credit markets that are painting a far from equivocal picture.
The Credit Markets' Point of View
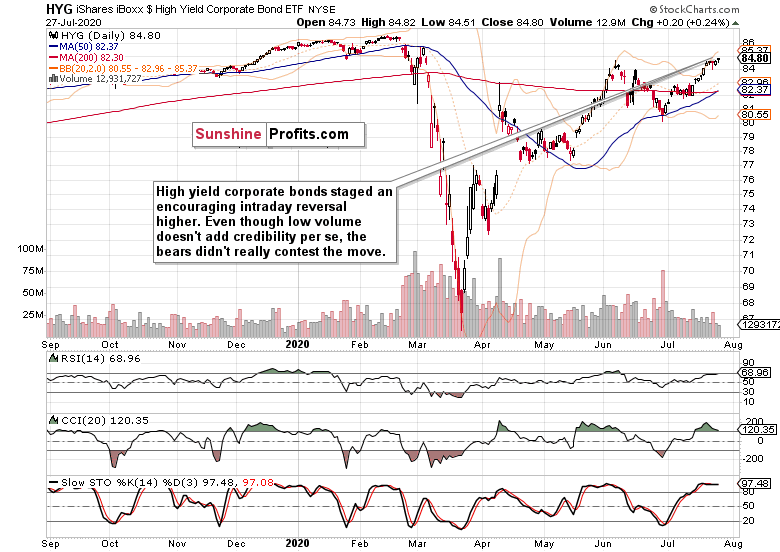
High yield corporate bonds (HYG ETF) recovered from the intraday downswing, and closed at its new July highs. Positive price action in itself, but the move lacked convincing volume. A mixed bag calling for caution, with the bulls getting the benefit of the doubt.
The investment grade corporate bonds (LQD ETF) declined (please see this and many more charts at my home site), and that's a short-term warning. While solidly trending higher, their current soft patch merits keeping a close eye on, as it doesn't confirm the HYG ETF upswing.
Next come the ratios to finetune the picture. Both the leading credit market ratios – high yield corporate bonds to short-term Treasuries (HYG:SHY) and investment grade corporate bonds to longer-dated Treasuries (LQD:IEI) aren't in tune with each other for a second trading day running. This hesitation has the potential to spill over into upcoming sessions.
In perspective, the longer-dated Treasuries also lost ground, with both TLT ETF and TLH ETF declining. Could we be looking at a rotation into riskier plays?
The comparison of both corporate bonds' varieties (HYG:LQD ratio) confirms that. The credit markets are indeed enjoying a relatively increased appetite for junk corporate bonds.
Then, the ratio of stocks to all Treasuries ($SPX:$UST) certainly shows that stocks aren't falling out of favor here. To the contrary, I see the ratio as likely to challenge its July highs, and move upwards. Given the new stimulus on the horizon, it's not out of the unexpected to see quality debt instruments gyrate on a short-term basis. Once the details are in, the dust settles, and new moves commence – that's what I am keenly looking out for.
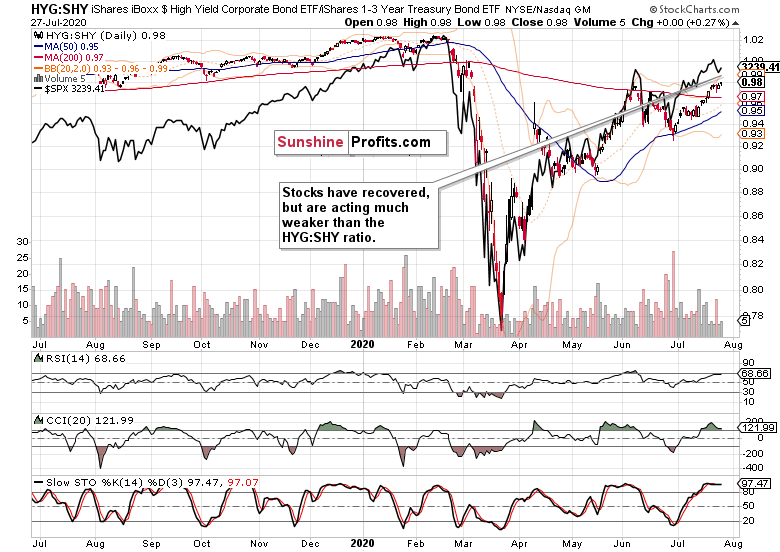
The overlaid S&P 500 closing prices (black line) against the HYG:SHY chart captures the momentary tensions. After a period of stocks outperforming the ratio starting in late June, the S&P 500 is taking a breather these days.
Smallcaps and Emerging Markets
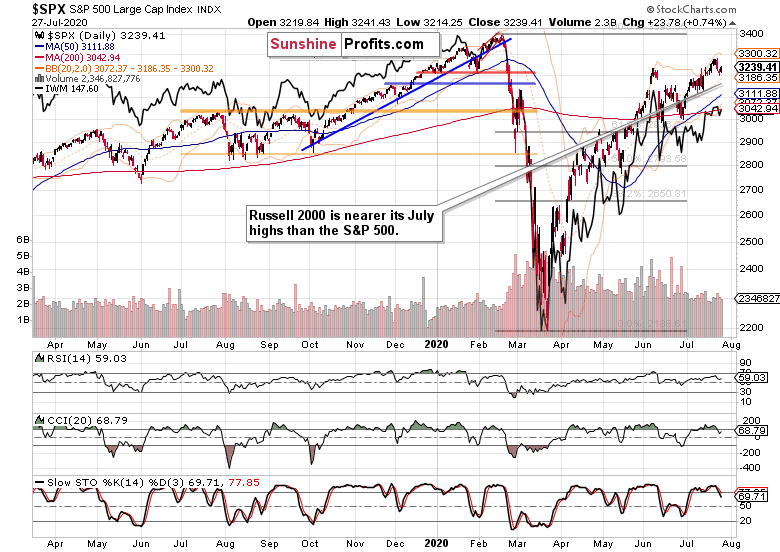
The Russell 2000 (IWM ETF) is acting constructively on a short-term basis – it's much closer to its July highs than the 500-strong index is.
As for emerging markets (EEM ETF), that's another cup of tea – they're strong not only in the very short-term, but also on the medium-term basis. That's a positive cue for U.S. stocks as well.
Summary
Summing up, the S&P 500 rose yesterday, but the credit markets aren't unilaterally supporting the upswing. Such a short-term non-confirmation of theirs can (and likely will) be resolved within the nearest sessions. Rotation into former laggards is underway, technology is not crashing through supports, market breadth keeps being healthy, and volatility is far from trending higher. Despite the stock upswing taking more than its fair share of time to unfold, more signs favor the upcoming upswing than not.
Want free follow-ups to the above article and details not available to 99%+ investors? Sign up to our free newsletter today!
Want free follow-ups to the above article and details not available to 99%+ investors? Sign up to our free newsletter today!
Author

Monica Kingsley
Monicakingsley
Monica Kingsley is a trader and financial analyst serving countless investors and traders since Feb 2020.