LNG tightens as routing stress and demand drive supply shifts

Key takeaways
- European LNG flows concentrate across a limited number of terminals as routing constraints intensify.
- Shipping disruption and Hormuz bottlenecks increase the importance of logistics in price formation.
- US demand resilience and European dependency reinforce pressure across the system.
LNG system adjusts through concentration and routing
The LNG system is moving through a phase where flows are reorganizing across infrastructure rather than expanding through additional supply. European intake remains active, with total flows reaching 473.4 mcm and showing a daily increase of over 50 mcm. Activity is not evenly distributed. A limited group of terminals absorbs a growing share of incoming cargo, creating a concentration profile that defines the current regime.
Zeebrugge (Belgium), Gate (Netherlands) and TVB together account for more than 30% of total European LNG flows, while the top five terminals approach half of the system. The Herfindahl–Hirschman Index remains elevated, confirming that the system operates through concentrated nodes rather than distributed capacity. This configuration establishes the structural baseline for how supply enters Europe.
Demand resilience supports energy flows
US demand remains solid and continues to provide a stable anchor for the energy system. Retail sales data confirms strong consumer activity, with both headline and core readings exceeding expectations. This reflects sustained purchasing power and supports a consistent level of energy consumption across the economy.
Higher consumption maintains pressure on the energy complex through steady demand for fuels, transport and industrial inputs. LNG remains embedded in this framework as part of the broader energy mix, with demand expectations extending beyond short term fluctuations.
Europe operates within a different constraint set. Storage rebuilding is underway, while the system still relies on external LNG inflows to secure supply. This dependence increases sensitivity to global flows and reinforces the importance of imported cargo in balancing regional demand.
The interaction between US demand resilience and European dependency defines the current macro backdrop. Consumption remains firm on one side of the system, while supply access and flow distribution shape availability on the other.
Routing constraints redefine flow efficiency
Shipping conditions are reshaping how LNG reaches Europe. Passage through key routes remains constrained, with traffic across the Strait of Hormuz reduced to minimal levels. Vessel movement reflects selective routing decisions under elevated risk conditions.
This environment extends transit times and introduces variability in delivery schedules. Cargo availability remains present, while delivery efficiency depends on route selection and fleet positioning. The system adapts through longer paths and alternative corridors.
Timing becomes a key variable in access to supply. Logistics moves to the center of price formation as the system absorbs disruption through adjustments in shipping patterns.
US LNG anchors supply while extending system duration
US LNG exports continue to provide the primary source of marginal supply for Europe. Cargo flows from the United States compensate for disruptions affecting Middle Eastern routes and stabilize overall availability.
This substitution extends the structure of the system. Transatlantic shipments require longer sailing times and depend on fleet availability. The increase in transit duration strengthens the link between shipping markets and LNG pricing.
European buyers operate within a system where supply is secured through longer chains, where origin, route and delivery timing define balance.
Infrastructure concentration shapes transmission across the network
The transmission of LNG flows across Europe depends on how concentrated inflows are redistributed through the network. High activity at a limited number of entry points channels supply into specific corridors, creating localized pressure and directional redistribution.
Northern hubs such as Zeebrugge and Gate function as primary gateways, while secondary terminals show more stable or declining activity. This establishes a hierarchy in infrastructure utilization rather than a uniform system.
Pipeline connectivity, storage access and proximity to demand centers determine how efficiently incoming LNG is transmitted inland. Concentration increases sensitivity to operational disruptions at key nodes and amplifies the importance of network coordination.
Shipping stress feeds into cost and delivery structure
Shipping data shows elevated stress across freight, risk and bunker layers, with strong signal intensity across all components. Risk indicators remain the dominant element in the current environment.
Freight equities reflect this tension. Crude tanker segments decline while product tankers maintain relative resilience. LNG shipping shows limited divergence, indicating a more stable but still constrained segment.
Bunker markets add another layer, with tightening fuel availability influencing maritime costs. Fuel pricing feeds directly into shipping economics and affects the delivered cost of LNG cargoes.
Shipping conditions feed into pricing through cost structure and delivery timing, linking logistics directly to market behavior.
Energy complex reflects divergence across layers
Cross-asset signals show divergence within the broader energy complex. Crude oil declines sharply, with Brent falling more than five percent on the day, while natural gas maintains a positive profile supported by flow dynamics.
Energy majors show strength, particularly in Europe, reflecting expectations of stable margins and continued relevance of LNG within the energy mix.
Different segments of the energy system respond to different drivers. Oil reacts to macro positioning and expectations, while LNG reflects logistics, routing and infrastructure constraints.
Technical structure: LNG builds release above structural base
These flow dynamics are reflected directly in price structure and positioning across the gas curve.
The technical structure shows a sustained upward sequence following a period of accumulation. Price advances toward the upper boundary of the current range, with continuation attempts testing recent highs.
The 2.70 area acts as the operational pivot where positioning concentrates and defines short term balance. Resistance develops between 2.73 and 2.75, where upward movement encounters supply and momentum slows.
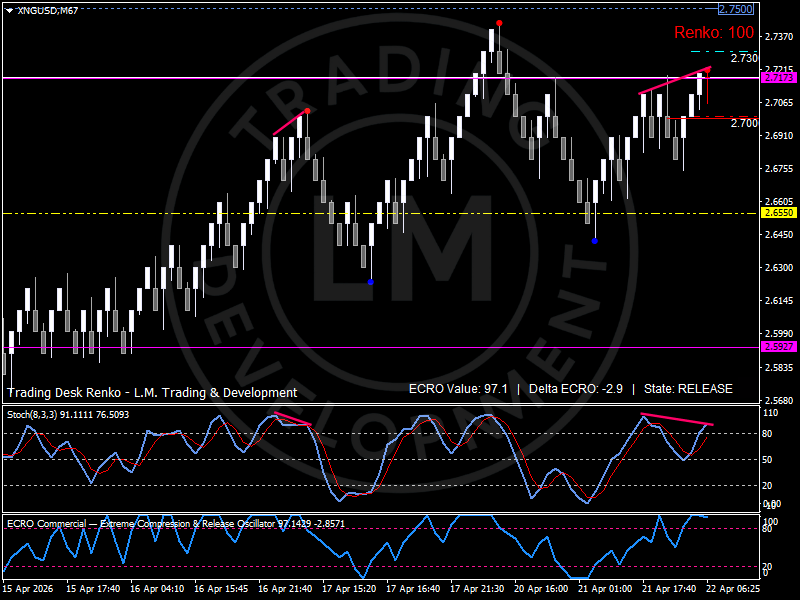
Support forms around 2.65 with a deeper structural base near 2.60, where previous pullbacks have been absorbed and continuation has resumed.
The ECRO indicator shows elevated readings above 95 with a slightly negative delta, indicating that the market remains in a release phase with momentum moderating after expansion.
Bird’s eye view: LNG market map
Market Regime: Release with concentration.
Regime Pivot: 2.70.
Expansion Zone: Acceptance above 2.75 supports continuation as routing inefficiencies persist and flows remain constrained.
Neutral Zone: Rotation between 2.65 and 2.73 reflects balance between incoming supply and logistical frictions.
Pressure Zone: A break below 2.60 signals a reduction in flow intensity and a shift toward broader rebalancing.
Systemic Indicators to Watch: Terminal concentration, freight conditions and routing efficiency remain the key drivers.
Outlook
European LNG flows continue to adjust through concentrated entry points and extended routing paths. Infrastructure access and shipping conditions define how supply is delivered and distributed across the system.
Sustained activity at key terminals supports the current structure, while routing constraints maintain pressure on delivery efficiency. Freight and bunker conditions influence cost dynamics and reinforce the link between logistics and pricing.
The next phase depends on how efficiently the system redistributes concentrated inflows across the network. Continued disruption supports the current regime, while improved routing efficiency would ease pressure and support broader rebalancing.
Author

Luca Mattei
LM Trading & Development
Luca Mattei is a market analyst focusing on FX, metals, and macroeconomic trends. He develops trading tools for retail and professional traders, coding indicators and EAs for MT4/MT5 and strategies in Pine Script for TradingView.


