Executive Summary
The debt-to-GDP ratio of the British government ballooned to 250 percent, where the Japanese ratio currently stands, twice in the past two centuries. In neither episode did the British government default nor did it actually reduce its outstanding stock of debt. Rather, the government relied on solid nominal GDP growth to de-lever. Raising nominal GDP growth seems straightforward in theory but can be difficult to achieve in practice, especially for a country like Japan which faces a number of constraints. Not only will the Japanese population contract in coming decades, but it is not readily apparent how stronger productivity growth is to be achieved.
Raising inflation would help to boost nominal GDP growth, but the Bank of Japan (BoJ) has had little success doing so over the past two decades. That said, the BoJ is not likely to sell down its massive holding of Japanese government bonds (JGBs) anytime soon. Therefore, JGB yields likely will remain depressed for some time.
Great Britain to Japan: "Been There, Done That"
Thirty years ago the government debt-to-GDP ratio in Japan was only 70 percent. Over the next 30 years, however, the combination of stagnant nominal GDP growth and gaping budget deficit caused the ratio to mushroom to 250 percent (Figure 1). With nearly ¥1300 trillion (almost $12 trillion) worth of debt outstanding, many observers are left wondering how the Japanese government will ever manage to pay it all back.
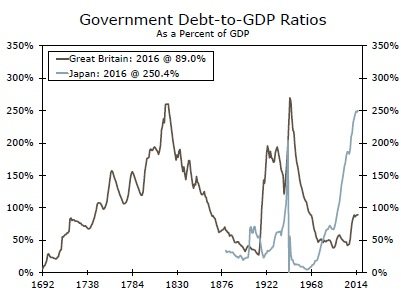
Figure 1 also makes clear that the current Japanese predicament is not without precedent. Specifically, the British government debt-to-GDP ratio reached similar levels twice in the past 200 years. The ratio in Great Britain stood at roughly 120 percent in the early 1790s, but subsequently climbed to 260 percent over the next 30 years during the Napoleonic Wars. The second episode was associated with another long and costly war. Between 1940 and 1946 the government debt-to-GDP ratio skyrocketed from 120 percent to 270 percent. Yet in both episodes the ratio eventually subsided without default by the British government. Are there lessons to be gleaned from the British experience that are applicable to Japan today?
Lessons from 200 Years of British Economic History
The first lesson is that reducing the debt-to-GDP ratio generally does not happen quickly. As noted above, Great Britain's debt-to-GDP ratio peaked at 260 percent in 1820, but it took about 35 years for it to recede to its pre-war level. The ratio fell more quickly following the Second World War, but it still took until 1960 for it to return to its pre-war level. In other words, investors should not expect the Japanese debt-to-GDP ratio to return to its pre-1990 level anytime soon.
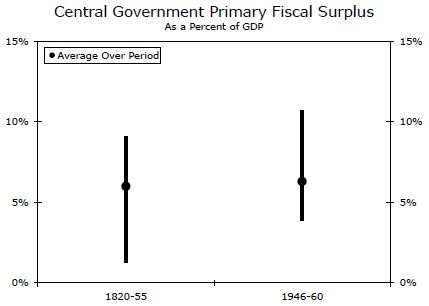
The second lesson is that fiscal restraint played a role in the de-levering process in both episodes, but it was not the primary means by which the reductions in the debt-to-GDP ratio were achieved. As shown in Figure 2, the primary budget surplus ranged between roughly 1 percent of GDP to 9 percent of GDP between 1820, when the debt-to-GDP ratio peaked, to 1855, when the ratio returned to its pre-war level.2 The primary budget surplus averaged 6 percent of GDP, which is a fairly high surplus, over that 35-year period. During the 1946-1960 de-levering episode, the primary surplus ranged from 4 percent to 10 percent with an average value of 6 percent again.
Yet despite a fair amount of fiscal restraint, the British government did not bring down the absolute amount of debt by any meaningful amount when it went through its two long periods of de-levering. The par value of British government debt totaled £838 million in 1820 when the debt-to-GDP ratio peaked, and it was more or less unchanged 35 years later. In the aftermath of World War II, government debt actually rose from about £25 billion in 1946 to £28 billion in 1960. The lesson from these two de-levering episodes in Great Britain is that the Japanese government does not really need to "pay back" its debt in order to de-lever. That is, the Japanese government does not actually need to reduce its ¥1300 trillion worth of outstanding debt to delever. It just needs to make interest payments and roll over its debt as it matures.
Shrinking the Ratio by Raising the Denominator
As noted above, the de-levering episodes that occurred in Great Britain between 1820 and 1855 and again between 1946 and 1960 were not achieved by a reduction in the numerator of the debtto- GDP ratio. Rather, the reductions were achieved primarily by increases in the denominator. That is, Great Britain grew its way out of its debt problems after the Napoleonic Wars and again after World War II.
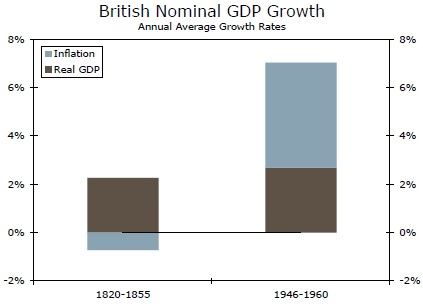
Between 1820 and 1855 real GDP growth in Great Britain averaged 2.3 percent per annum (Figure 3). Because the price level fell at an average rate of 0.7 percent per year during this period, nominal GDP growth averaged only 1.6 percent per annum during this 35-year period. Nevertheless, nominal GDP rose 70 percent between 1820 and 1855, which was enough to bring about a meaningful reduction in the government's debt-to-GDP ratio. The de-levering that occurred after the Second World War occurred more quickly because nominal GDP growth averaged 7 percent per annum between 1946 and 1960. The annual average real GDP growth rate of 2.7 percent in the second de-levering period was a bit stronger than the rate that was achieved during the first period, but it was the inflationary record that really distinguishes the two periods. As previously noted, the price level actually fell between 1820 and 1855. Prices in the United Kingdom rose at an average annual rate of 4.4 percent between 1946 and 1960.
De-levering by the Japanese Government Is Possible, But...
So the task facing Japan is actually quite simple, at least in theory. All Japan needs to do is raise its nominal GDP growth rate to grow its way out of its current debt problem. In practice, however, the task is much more difficult. Nominal GDP in Japan is essentially no higher today than it was in 1997. If the task were so easy, Japanese authorities probably would have figured out how to raise nominal GDP growth a long time ago.
First, there is the issue of real GDP growth. Real GDP in Great Britain grew more than 2 percent per annum during its two de-levering episodes due, at least in part, to positive population growth, which is one of the ingredients of potential GDP growth.3 During its de-levering period in the 19th century the British population grew in excess of 1 percent per annum. Population growth slowed in the 20th century, but the number of U.K. residents grew about 0.5 percent per year between 1946 and 1960.
will continue to decline between now and the end of the century. Despite fewer workers, Japan could still achieve strong real GDP growth if productivity growth were robust. However, Japanese productivity has essentially been stagnant since the global financial crisis, and it is not apparent what will lift it meaningfully in the foreseeable future.
The second issue for Japan is inflation, or rather the lack thereof in recent years. Elevated inflation pushed up British nominal GDP growth in the years following World War II, which contributed to the marked decline in the debt-to-GDP ratio by 1960. In contrast, Japan has been dealing with mild deflation on and off for the past 20 years (Figure 5). Indeed, the consumer price index in Japan has been essentially flat on balance since 1998.
Implications for Japanese Economic Policy
So the overall lesson from two centuries of British economic history is that the Japanese government can de-lever over the next few decades, but it needs some changes in economic policy in order to do so. First, the Japanese government has incurred large primary deficits for the past two decades (Figure 6), which arguably need to be reined in, at least in a non-abrupt fashion. As noted above, the British government ran primary surpluses, which helped to restrain the rise in the absolute amount of debt outstanding, during its two de-levering episodes. Fiscal restraint in Japan would help to reduce the government debt-to-GDP ratio in that country as well. That said, the Japanese government probably would want to phase in fiscal restraint gradually rather than in an abrupt manner. The government raised the consumption tax in 1997, which contributed to the subsequent Japanese recession in 1998. The government raised the consumption tax again in early 2014, and the economy experienced a mild recession later that year. Fiscal consolidation, if implemented too quickly, can be counterproductive. That is, severe austerity can throw an economy into recession, thereby leading to higher deficits and debt.
Second, Japan desperately needs stronger growth in nominal GDP, which can occur via more robust growth in real GDP and/or higher inflation. The demographics in Japan are more or less set for the foreseeable future, but higher labor force participation among females could lead to stronger growth in Japanese real GDP while the transition to a higher participation rate was taking place.4 Acceleration in productivity would also help to lift real GDP growth in Japan. In that regard, some of the proposed structural reforms that originally were part of Abenomics, but which subsequently have not advanced very far, have an important role to play in raising real GDP growth. Stronger real GDP growth in Japan is certainly possible, but it may take some painful adjustments in the Japanese economy to bring it about.
Japan also needs higher inflation to push up its nominal GDP growth rate. Despite a staggering increase in the size of its balance sheet in recent years (Figure 7), the BoJ has not had much success engineering higher inflation. Until inflation starts to rise on a clearly sustainable basis, the BoJ could very well continue to expand the size of its balance sheet. At a minimum, it is not likely to shrink its balance sheet anytime soon. At present, the BoJ holds about 40 percent of all JGBs outstanding. This massive amount of JGB holdings by the BoJ undoubtedly has contributed to the marked decline in their yields in recent yields. With the BoJ not likely to reduce the size of its balance sheet anytime soon, JGB yields likely will remain depressed for the foreseeable future. In other words, Japanese authorities are likely to impose a form of "financial repression" in its de-levering process in coming years.5
Conclusion
The debt-to-GDP ratio of the Japanese government currently stands at 250 percent, the highest ratio among advanced economies at present. The British government has experienced comparable ratios of debt twice during the past two centuries without defaulting on its obligations. So what can the Japanese learn from the two episodes of government de-levering in Great Britain?
First, significant de-levering can take decades. It took 35 years after the Napoleonic Wars for the British government to bring its debt-to-GDP ratio down to the pre-war level. Second, it is not necessary to bring down the absolute amount of debt outstanding to de-lever. The debt-to-GDP ratio can be brought down simply by growing out of the problem (i.e., via nominal GDP growth, which raises the denominator). Fiscal restraint can help hold down the numerator, but it can also be counterproductive if administered too abruptly.
Raising nominal GDP growth seems straightforward in theory but can be difficult to achieve in practice, especially for a country like Japan which faces a number of constraints. Because the population of Japan likely will contract markedly over the next few decades, it will take some combination of higher labor force participation, especially among females, and productivity acceleration to bring about stronger real GDP growth over a sustained period. Higher labor force participation entails less leisure for some individuals, which may not be entirely pleasant for them, and it is not readily apparent how stronger productivity growth is to be achieved.
Higher inflation would help to boost nominal GDP growth, but the BoJ has not had much success engineering higher inflation over the past two decades. However, unless the BoJ totally scraps its view about quantitative easing, which does not seem likely anytime soon, its balance sheet will remain bloated for the foreseeable future. Consequently, JGB yields likely will remain depressed for some time.
Recently, the stock market has experienced high levels of volatility. If you are thinking about participating in fast moving markets, please take the time to read the information below. Wells Fargo Investments, LLC will not be restricting trading on fast moving securities, but you should understand that there can be significant additional risks to trading in a fast market. We've tried to outline the issues so you can better understand the potential risks. If you're unsure about the risks of a fast market and how they may affect a particular trade you've considering, you may want to place your trade through a phone agent at 1-800-TRADERS. The agent can explain the difference between market and limit orders and answer any questions you may have about trading in volatile markets. Higher Margin Maintenance Requirements on Volatile Issues The wide swings in intra-day trading have also necessitated higher margin maintenance requirements for certain stocks, specifically Internet, e-commerce and high-tech issues. Due to their high volatility, some of these stocks will have an initial and a maintenance requirement of up to 70%. Stocks are added to this list daily based on market conditions. Please call 1-800-TRADERS to check whether a particular stock has a higher margin maintenance requirement. Please note: this higher margin requirement applies to both new purchases and current holdings. A change in the margin requirement for a current holding may result in a margin maintenance call on your account. Fast Markets A fast market is characterized by heavy trading and highly volatile prices. These markets are often the result of an imbalance of trade orders, for example: all "buys" and no "sells." Many kinds of events can trigger a fast market, for example a highly anticipated Initial Public Offering (IPO), an important company news announcement or an analyst recommendation. Remember, fast market conditions can affect your trades regardless of whether they are placed with an agent, over the internet or on a touch tone telephone system. In Fast Markets service response and account access times may vary due to market conditions, systems performance, and other factors. Potential Risks in a Fast Market "Real-time" Price Quotes May Not be Accurate Prices and trades move so quickly in a fast market that there can be significant price differences between the quotes you receive one moment and the next. Even "real-time quotes" can be far behind what is currently happening in the market. The size of a quote, meaning the number of shares available at a particular price, may change just as quickly. A real-time quote for a fast moving stock may be more indicative of what has already occurred in the market rather than the price you will receive. Your Execution Price and Orders Ahead In a fast market, orders are submitted to market makers and specialists at such a rapid pace, that a backlog builds up which can create significant delays. Market makers may execute orders manually or reduce size guarantees during periods of volatility. When you place a market order, your order is executed on a first-come first-serve basis. This means if there are orders ahead of yours, those orders will be executed first. The execution of orders ahead of yours can significantly affect your execution price. Your submitted market order cannot be changed or cancelled once the stock begins trading. Initial Public Offerings may be Volatile IPOs for some internet, e-commerce and high tech issues may be particularly volatile as they begin to trade in the secondary market. Customers should be aware that market orders for these new public companies are executed at the current market price, not the initial offering price. Market orders are executed fully and promptly, without regard to price and in a fast market this may result in an execution significantly different from the current price quoted for that security. Using a limit order can limit your risk of receiving an unexpected execution price. Large Orders in Fast Markets Large orders are often filled in smaller blocks. An order for 10,000 shares will sometimes be executed in two blocks of 5,000 shares each. In a fast market, when you place an order for 10,000 shares and the real-time market quote indicates there are 15,000 shares at 5, you would expect your order to execute at 5. In a fast market, with a backlog of orders, a real-time quote may not reflect the state of the market at the time your order is received by the market maker or specialist. Once the order is received, it is executed at the best prices available, depending on how many shares are offered at each price. Volatile markets may cause the market maker to reduce the size of guarantees. This could result in your large order being filled in unexpected smaller blocks and at significantly different prices. For example: an order for 10,000 shares could be filled as 2,500 shares at 5 and 7,500 shares at 10, even though you received a real-time quote indicating that 15,000 shares were available at 5. In this example, the market moved significantly from the time the "real-time" market quote was received and when the order was submitted. Online Trading and Duplicate Orders Because fast markets can cause significant delays in the execution of a trade, you may be tempted to cancel and resubmit your order. Please consider these delays before canceling or changing your market order, and then resubmitting it. There is a chance that your order may have already been executed, but due to delays at the exchange, not yet reported. When you cancel or change and then resubmit a market order in a fast market, you run the risk of having duplicate orders executed. Limit Orders Can Limit Risk A limit order establishes a "buy price" at the maximum you're willing to pay, or a "sell price" at the lowest you are willing to receive. Placing limit orders instead of market orders can reduce your risk of receiving an unexpected execution price. A limit order does not guarantee your order will be executed -" however, it does guarantee you will not pay a higher price than you expected. Telephone and Online Access During Volatile Markets During times of high market volatility, customers may experience delays with the Wells Fargo Online Brokerage web site or longer wait times when calling 1-800-TRADERS. It is possible that losses may be suffered due to difficulty in accessing accounts due to high internet traffic or extended wait times to speak to a telephone agent. Freeriding is Prohibited Freeriding is when you buy a security low and sell it high, during the same trading day, but use the proceeds of its sale to pay for the original purchase of the security. There is no prohibition against day trading, however you must avoid freeriding. To avoid freeriding, the funds for the original purchase of the security must come from a source other than the sale of the security. Freeriding violates Regulation T of the Federal Reserve Board concerning the extension of credit by the broker-dealer (Wells Fargo Investments, LLC) to its customers. The penalty requires that the customer's account be frozen for 90 days. Stop and Stop Limit Orders A stop is an order that becomes a market order once the security has traded through the stop price chosen. You are guaranteed to get an execution. For example, you place an order to buy at a stop of $50 which is above the current price of $45. If the price of the stock moves to or above the $50 stop price, the order becomes a market order and will execute at the current market price. Your trade will be executed above, below or at the $50 stop price. In a fast market, the execution price could be drastically different than the stop price. A "sell stop" is very similar. You own a stock with a current market price of $70 a share. You place a sell stop at $67. If the stock drops to $67 or less, the trade becomes a market order and your trade will be executed above, below or at the $67 stop price. In a fast market, the execution price could be drastically different than the stop price. A stop limit has two major differences from a stop order. With a stop limit, you are not guaranteed to get an execution. If you do get an execution on your trade, you are guaranteed to get your limit price or better. For example, you place an order to sell stock you own at a stop limit of $67. If the stock drops to $67 or less, the trade becomes a limit order and your trade will only be executed at $67 or better. Glossary All or None (AON) A stipulation of a buy or sell order which instructs the broker to either fill the whole order or don't fill it at all; but in the latter case, don't cancel it, as the broker would if the order were filled or killed. Day Order A buy or sell order that automatically expires if it is not executed during that trading session. Fill or Kill An order placed that must immediately be filled in its entirety or, if this is not possible, totally canceled. Good Til Canceled (GTC) An order to buy or sell which remains in effect until it is either executed or canceled (WellsTrade® accounts have set a limit of 60 days, after which we will automatically cancel the order). Immediate or Cancel An order condition that requires all or part of an order to be executed immediately. The part of the order that cannot be executed immediately is canceled. Limit Order An order to buy or sell a stated quantity of a security at a specified price or at a better price (higher for sales or lower for purchases). Maintenance Call A call from a broker demanding the deposit of cash or marginable securities to satisfy Regulation T requirements and/or the House Maintenance Requirement. This may happen when the customer's margin account balance falls below the minimum requirements due to market fluctuations or other activity. Margin Requirement Minimum amount that a client must deposit in the form of cash or eligible securities in a margin account as spelled out in Regulation T of the Federal Reserve Board. Reg. T requires a minimum of $2,000 or 50% of the purchase price of eligible securities bought on margin or 50% of the proceeds of short sales. Market Makers NASD member firms that buy and sell NASDAQ securities, at prices they display in NASDAQ, for their own account. There are currently over 500 firms that act as NASDAQ Market Makers. One of the major differences between the NASDAQ Stock Market and other major markets in the U.S. is NASDAQ's structure of competing Market Makers. Each Market Maker competes for customer order flow by displaying buy and sell quotations for a guaranteed number of shares. Once an order is received, the Market Maker will immediately purchase for or sell from its own inventory, or seek the other side of the trade until it is executed, often in a matter of seconds. Market Order An order to buy or sell a stated amount of a security at the best price available at the time the order is received in the trading marketplace. Specialists Specialist firms are those securities firms which hold seats on national securities exchanges and are charged with maintaining orderly markets in the securities in which they have exclusive franchises. They buy securities from investors who want to sell and sell when investors want to buy. Stop An order that becomes a market order once the security has traded through the designated stop price. Buy stops are entered above the current ask price. If the price moves to or above the stop price, the order becomes a market order and will be executed at the current market price. This price may be higher or lower than the stop price. Sell stops are entered below the current market price. If the price moves to or below the stop price, the order becomes a market order and will be executed at the current market price. Stop Limit An order that becomes a limit order once the security trades at the designated stop price. A stop limit order instructs a broker to buy or sell at a specific price or better, but only after a given stop price has been reached or passed. It is a combination of a stop order and a limit order. These articles are for information and education purposes only. You will need to evaluate the merits and risks associated with relying on any information provided. Although this article may provide information relating to approaches to investing or types of securities and investments you might buy or sell, Wells Fargo and its affiliates are not providing investment recommendations, advice, or endorsements. Data have been obtained from what are considered to be reliable sources; however, their accuracy, completeness, or reliability cannot be guaranteed. Wells Fargo makes no warranties and bears no liability for your use of this information. The information made available to you is not intended, and should not be construed as legal, tax, or investment advice, or a legal opinion.
Recommended Content
Editors’ Picks
USD/JPY holds positive ground around 151.50 following Japanese CPI data
The USD/JPY pair holds positive ground for the second consecutive day near 151.45 on Friday during the early Asian trading hours. The cautious approach from the Bank of Japan to keep monetary conditions accommodative exerts some selling pressure on the Japanese Yen.
AUD/USD depreciates on risk aversion amid a stronger US Dollar
AUD/USD extends its losses for the second successive session on Friday. However, market activity is expected to be subdued due to light trading on Good Friday. Meanwhile, the US Dollar strengthens as recent data indicates annualized economic expansion in the United States, driven by consumer spending.
Gold price finishes Thursday’s session set to reach new all-time highs
Gold price rallied during the North American session on Thursday and hit a new all-time high of $2,225 in the mid-North American session. Precious metal prices are trending higher even though US Treasury yields are advancing, underpinning the Greenback.
Top 3 Price Prediction BTC, ETH, XRP: Retail watches from the sidelines with a bias for shorts
Bitcoin is showing strength as markets head into the Easter holidays. As it rises, altcoins are following suit, with Ethereum and Ripple posting almost similar gains. Meanwhile, there remains an unfilled CME Gap, with a lot of liquidity also resting above and below BTC price.
Bears have been standing before a steamroller so far this year
Despite a pushback on rate cuts from Christopher Waller, and what was supposed to be cautious trading sentiment ahead of critical US inflation data released later on Friday, the S&P 500 rose on Thursday, marking its best first-quarter performance in five years.