Kiss of life for gold

The narrow trading range in stocks continues, and the shallow sideways correction will eventually resolve itself with another upleg. The signs are countless, and the riskier part of the credit market spectrum agrees. As money flows from the Tresury markets, and sizable cash balances are sitting on many a balance sheet, there is plenty of fuel to power the S&P 500 advance.
With volatility in the tame low 20s and the put/call ratio again moving down, the bears‘ prospects are bleak. As I wrote last week, their time is running out, and a new stock market upleg approaches. It‘s the bond market that‘s under pressure, with both investment grade corporate bonds and long-dated Treasuries suffering in the accelerated decline.
Gold is the most affected, as the sensitivity of its reaction to the rising long-tern yields, has picked up very noticeably. How long before these draw both the Fed‘s attention and action –" what will we learn from Powell‘s testimony on Tue and Wed? And when will the much awaited stimulus finally arrive, and force repricing beyond the metals markets?
Before that, gold remains on razor‘s edge, while silver leads and platinum flies for all the green hydrogen promise. The dollar has given back on Thu and Fri what it gained two days before, and remains in its bear market. Not even rising yields were able to generate much demand for the world reserve currency. Its lower prices stand to help gold thanks to the historically prevailing negative correlation, counterbalancing the Treasury yields pressure.
Plenty of action that‘s bound to decide the coming weeks‘ shape in the precious metals. And not only there as oil experienced 2 days of lossess in a row –" practically unheard of in 2021 so far. On Saturday, I‘ve added a new section to my site, Latest Highlight, for easier orientation in the milestone calls and timeless pieces beyond the S&P 500 and gold. Enjoy!
Let‘s get right into the charts.
S&P 500 Outlook
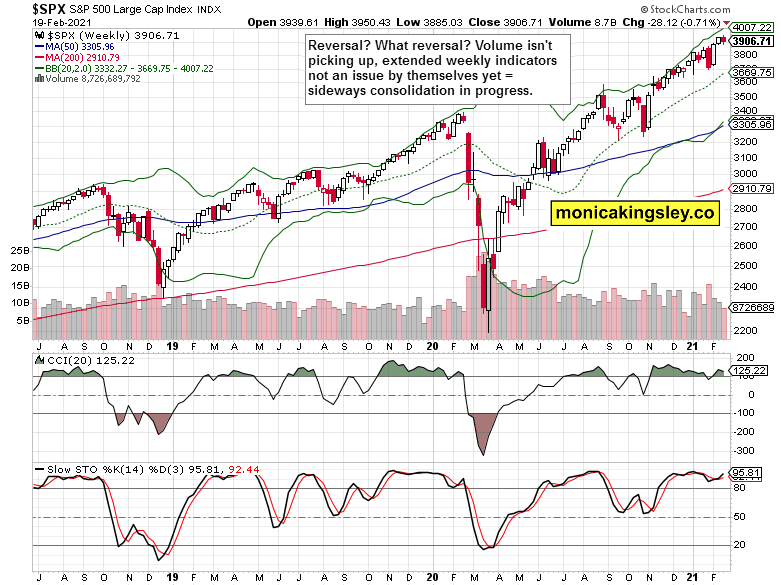
The weekly indicators suggest that a reversal is still not likely. There is no conviction behind the weekly decline, and signs are still pointing to a sideways consolidation underway.
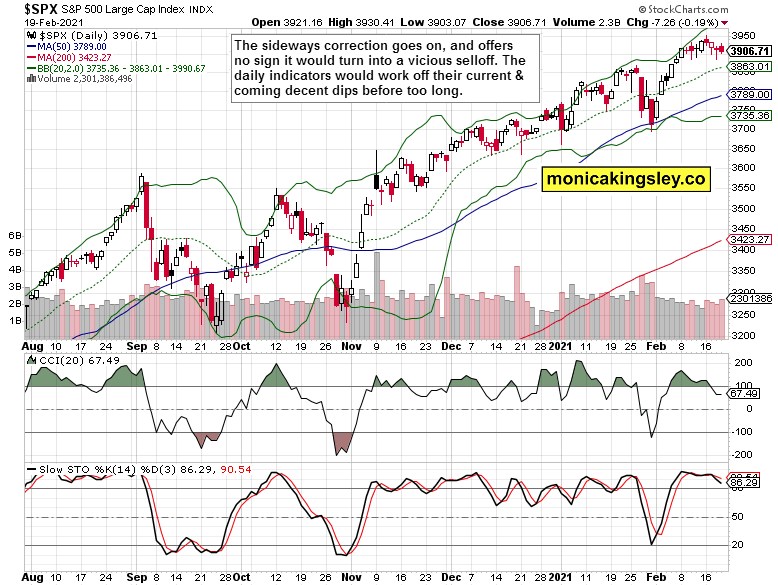
The daily chart reflects the relatively uneventful trading –" we‘re in a phase of bullish base building before powering off to new highs. See how little the daily indicators have retreated from their extended readings, and the barely noticeable price decline associated.
S&P 500 Internals
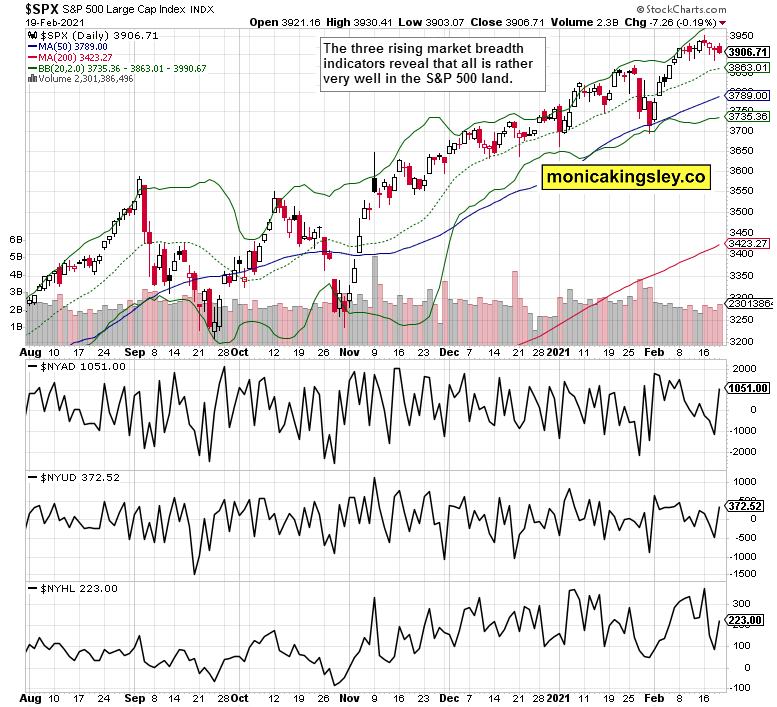
All the three market breadth indicators show improved readings, and my eyes are on new highs new lows throwing their weight behind the prior two indicators‘ advance. The overall impression is one of balance.
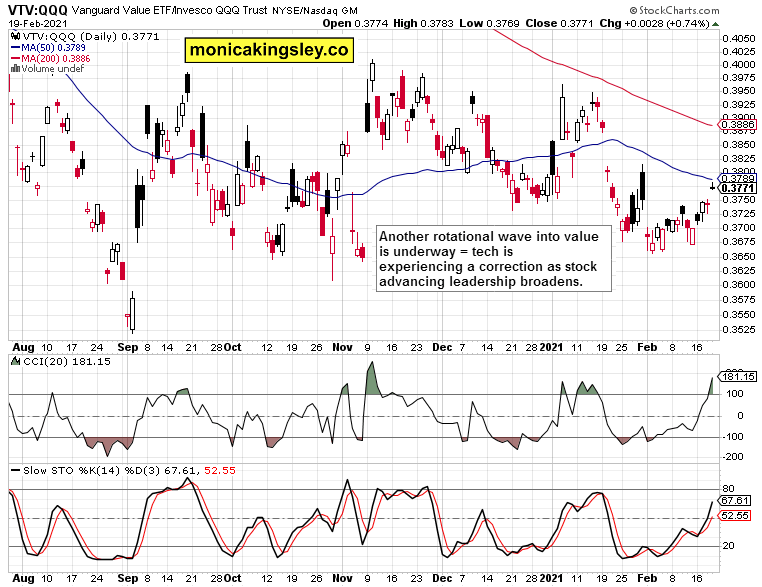
The value to growth (VTV:QQQ) ratio shows that tech (XLK ETF) has fallen a bit out out of step recently –" we‘re undergoing another microrotation into value stocks. The stock market leadership is thus broadening, confirming the findings from the advance-decline line (and advance-decline volume) examination.
Credit Markets
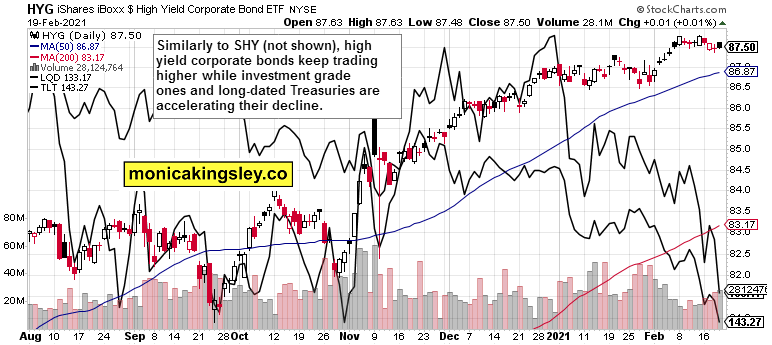
One chart to illustrate the bond market pressures –" high yield corporate bonds are holding gained ground while investment grade corporate bonds and long-dated Treasuries are plunging like there is no tomorrow. With each of their rebound attempt sold, the dislocations are increasing –" a great testament to the euphoric stage of the stock market advance.
Gold and Treasuries
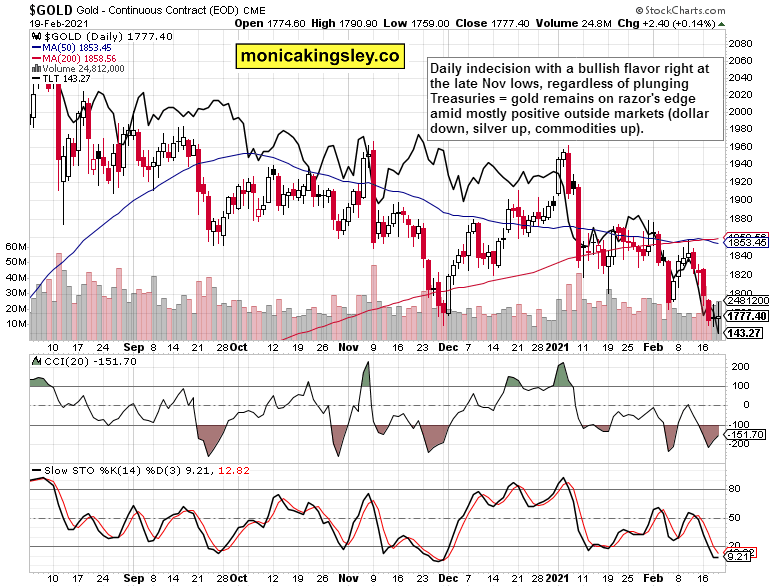
Gold price action isn‘t as bearish as it might seem based on last week‘s moves. Yes, the readiness to decline in sympathy with rising yields, is diconcerting, but the yellow metal stopped practically at the late Nov lows, and refused to decline further. Low prices attracted buying interest, and due to the overwhelmingly negative sentiment for the week ahead, the yellow metal may surprise on the upside. Time for the bulls to prove themselves as the tone of coming weeks‘ trading in gold is in the balance.
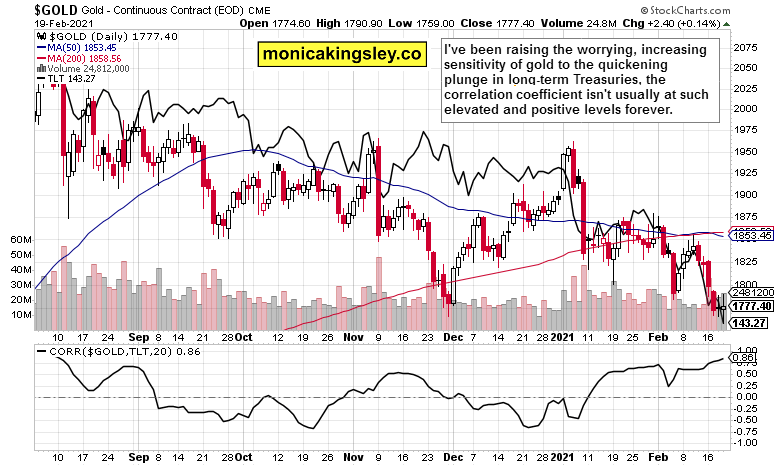
The daily chart‘s correlation coefficient has moved into strongly positive territory in 2021, illustrating the headwinds gold faces. Despite the prevailing wisdom, such strongly positive correlation isn‘t the rule over extended periods of time. That‘s the message of the daily chart –" but let‘s step back and see the bigger picture similarly to the way I did on Friday witht the $HUI:$GOLD ratio.
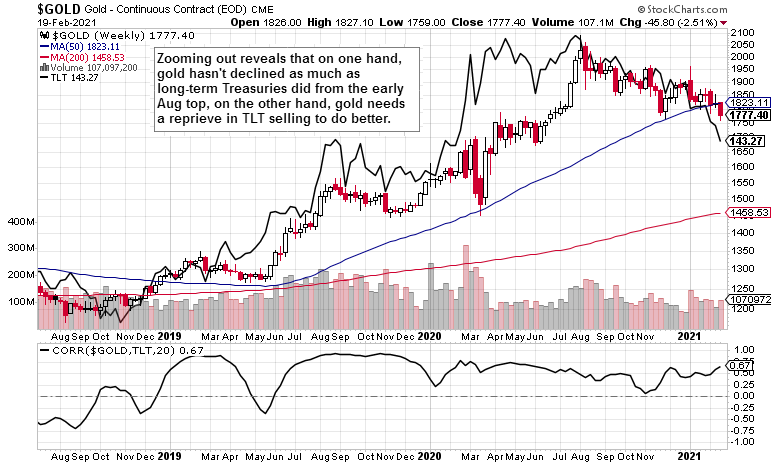
Not an encouraging sight at the moment. The tightness of mutual relationship is there, and given the decreased focus on timing (one candle representing one week) coupled with the correlation coefficient being calculated again over a 20 period sample, the week just over shows that regardless of the post-Nov resilience, gold is clearly getting under more pressure.
Gold and Dollar
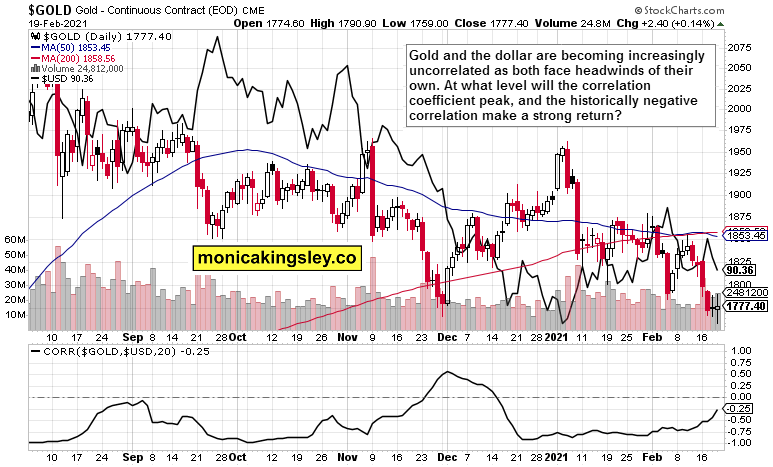
Let‘s do the same what I did about long-term Treasuries and gold, also about the dollar and gold. Their historically negative correlation is receding at the moment as the two face their own challenges. The key question is when and from what level would the fiat currency and its nemesis return to trading in the opposite directions. Such a time is highly likely to be conducive to higher gold prices.
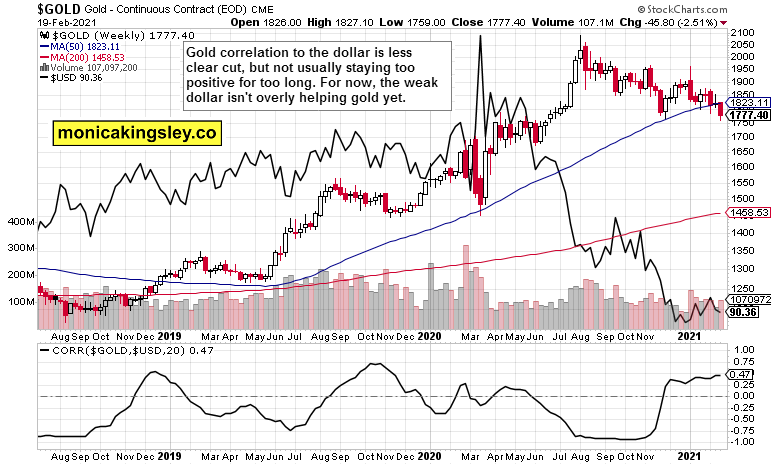
On the weekly chart, the negative correlation periods are winning out in length and frequency. Certainly given the less sensitive timining component through weekly candlesticks and 20-period calculation, the current strength and level of positive correlation is rather an exception and not a rule. Combining this chart‘s positive correlation between the two with the daily chart‘s negative yet rising readings, highlights in my view a potential for seeing an upset in the momentary relationship.
In other words, the gold decline over the past now almost 7 months going hand in hand with mostly sliding dollar, would turn into higher gold prices accompanied by lower dollar values. How much higher gold prices, that depends on the long-term Treasuries market –" that‘s the one playing the decisive role, not the dollar at the moment.
Gold, Silver and Miners
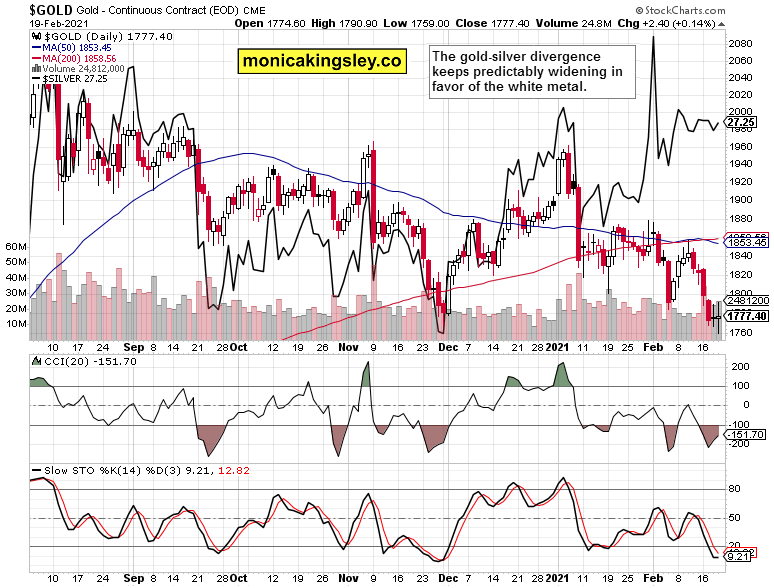
Silver is doing fine, platinum very well, while gold struggles and needs to prove itself. That‘s the essence of the long silver short gold trade idea –" the silver to gold ratio attests to that.
Quoting from Friday‘s analysis:
(…) The dynamics favoring silver are unquestionable –" starting from varied and growing industrial applications, strengthening manufacturing and economy recovery, poor outlook in silver above ground stockpile and recycling, to the white metal being also a monetary metal. Silver is bound to score better gains than gold, marred by the Bitcoin allure, would.
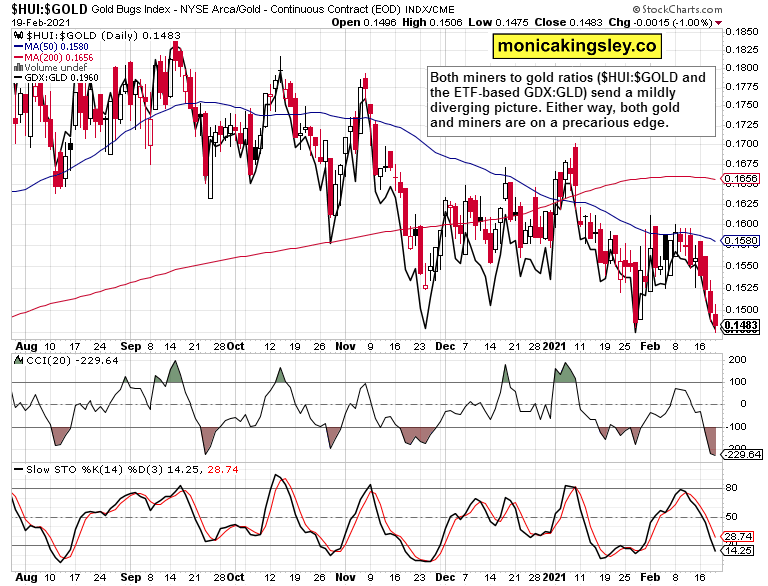
Final chart of today‘s extensive analysis is about the two miners to gold ratios, and the divergencies they show. The ETF-based one (GDX:GLD) is sitting at support marked by both the late Nov and late Jan lows, while $HUI:$GOLD is probing to break below its late Jan lows, and these were already lower than the respective late Nov lows.
Both ratios are sending a mixed picture, in line with the theme of my latest reports –" gold is on razor‘s edge, and the technical picture is mixed given its latest weakness. That‘s the short run –" I expect that once the Fed‘s hand is twisted enough in TLT and TLH, and speculation on yield curve control initiation rises, the focus in the precious metals would shift to inflation and its dynamics I‘ve described both on Wed and Fri.
Summary
The sellers in stocks aren‘t getting far these days, and signals remain aligned behind the S&P 500 advance to reassert itself. Neither the Russell 2000, nor emerging markets are flashing divergencies, and the path of least resistance in stocks remains higher.
Gold‘s short-term conundrum continues - positive fundamentals that are going to turn even more so in the near future, yet the key charts show the king of metals under pressure, with long-term Treasury yields arguably holding the key to gold‘s short-term future. The decoupling events seen earlier this month, got a harsh reality check in the week just over. Yet, that‘s not a knock-out blow –" the medium- and long-term outlook remains bright, and too many market players have rushed to the short side in the short run too.
Author

Monica Kingsley
Monicakingsley
Monica Kingsley is a trader and financial analyst serving countless investors and traders since Feb 2020.


