Job Market Reduces Recession Risk [Video]
![Job Market Reduces Recession Risk [Video]](https://editorial.fxstreet.com/images/Macroeconomics/EconomicIndicator/EconomicHealth/GDP/Recession/recession-5972376_XtraLarge.jpg)
US Dollar: June USD is Down at 96.885.
Energies: May '19 Crude is Up at 63.38.
Financials: The Jun 30 year bond is Up 4 ticks and trading at 148.02.
Indices: The June S&P 500 emini ES contract is 18 ticks Lower and trading at 2891.50.
Gold: The April Gold contract is trading Up at 1300.90 Gold is 54 ticks Higher than its close.
Initial Conclusion
This is not a correlated market. The dollar is Down- and Crude is Up+ which is normal but the 30 year Bond is trading Lower. The Financials should always correlate with the US dollar such that if the dollar is lower then bonds should follow and vice-versa. The S&P is Lower and Crude is trading Higher which is correlated. Gold is trading Higher which is correlated with the US dollar trading Up. I tend to believe that Gold has an inverse relationship with the US Dollar as when the US Dollar is down, Gold tends to rise in value and vice-versa. Think of it as a seesaw, when one is up the other should be down. I point this out to you to make you aware that when we don't have a correlated market, it means something is wrong. As traders you need to be aware of this and proceed with your eyes wide open.
At this hour Asia is trading mainly Lower with the exception of the Hang Seng which is trading Higher. Currently all of Europe is trading Lower.
Possible Challenges To Traders Today
-
Factory Orders m/m are out at 10 AM EST. This is major.
-
Lack of major economic news.
Treasuries
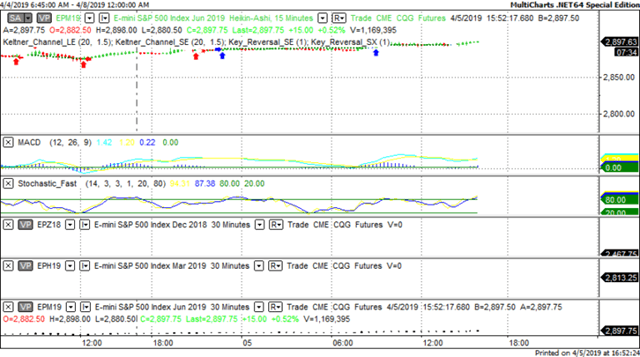
We've elected to switch gears a bit and show correlation between the 30 year bond (ZB) and The YM futures contract. The YM contract is the DJIA and the purpose is to show reverse correlation between the two instruments. Remember it's liken to a seesaw, when up goes up the other should go down and vice versa.
On Friday the ZB made a major move at around 9 AM EST. The ZB hit a High at around that time and the YM hit a Low. If you look at the charts below ZB gave a signal at around 9 AM EST and the YM was moving Higher at the same time. Look at the charts below and you'll see a pattern for both assets. ZB hit a High at around 9 AM and the YM was moving Higher at the same time. These charts represent the newest version of MultiCharts and I've changed the timeframe to a 15 minute chart to display better. This represented a shorting opportunity on the 30 year bond, as a trader you could have netted about 10 ticks per contract on this trade. Each tick is worth $31.25. Please note: the front month for the ZB contract is now June, 2019
Charts Courtesy of MultiCharts built on an AMP platform.
-636903113324014635.png)
Bias
On Friday we gave the markets a Neutral bias as it was Jobs Friday and we always maintain a Neutral bias on that day. The Dow closed Higher by about 40 points and the other indices gained ground as well. Today we aren't dealing with a correlated market and our bias is to the Downside.
Could this change? Of Course. Remember anything can happen in a volatile market.
Commentary
Friday was Non Farm Payrolls and it seems the US economy created 196,000 net new jobs versus the estimate of 172,000. The Unemployment rate remained steady at 3.8% and the markets took this as very positive news with all indices registering gains for the day. The bigger question should be can a continued strong labor market ward off a recession? In recent days the analysts and pundits have all been clamoring for recession stating that it time or due. However if the labor market remains strong can this occur? The likelihood is no, very simply because if people are working and have an income they will spend if they feel the long range prospects for continued employment are high. Lets face it, 70% of the US economy is based on consumer spending and if the consumer has the means (a job) to continue spending they will do so and the economy will grow. Now some publicly traded firms may take a hit but that is only because they missed expectations and in an environment where nothing short of perfection will do, some of those firms will take a hit but the economy will grow nonetheless. Need proof? Take a look at the 1950's and 1960's. The US economy grew but the stock market did not. The Dow didn't the 1,000 mark until 1972. I remember this clearly as I worked for Cohen, Simonson and Rea at 125 Broadway as a mail room clerk. I was 17 and working full time...
Author

Nick Mastrandrea
Market Tea Leaves


