Jackson Hole Preview: EUR/USD key levels: 1.20 and 1.16, Cable looks heavy

EUR/USD witnessed a bullish descending triangle breakout on Monday, but is struggling to extend gains beyond 1.1830 levels as many in the markets are expecting hawkish sound bites from Fed’s Yellen.
As discussed here, Trump’s dismal performance so far and the resulting USD weakness has created enough room for the Fed to begin tapering its balance sheet/normalize the policy. Yellen is also likely to reiterate the scope for one more rate hike later this year. The central bank intends to get ready for the next round of recession, thus policy normalization process is less data [inflation] dependent.
Keep an eye on the yield curve
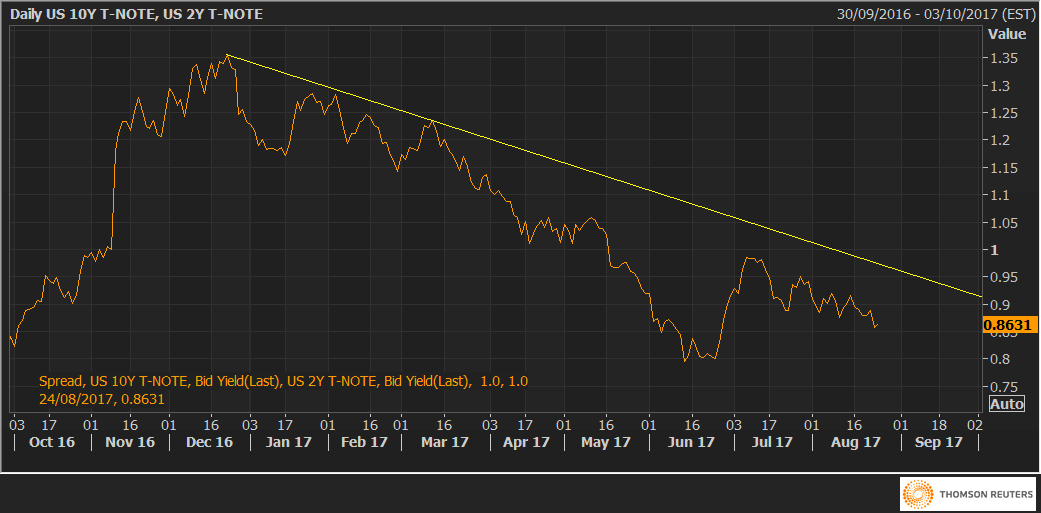
- USD loves a steeper yield curve [spread between the 10-year yield and the 2-year yield] and vice versa.
- The spread currently stands at 86 basis points.
- Hawkish comments from Yellen could see the spread widen to the falling trend line hurdle of 96 basis points.
- A break above 96 bps could signal a trend reversal in the US dollar. Such a move looks likely if Yellen's comments hint at a faster balance sheet unwind.
EUR vulnerable to jawboning
ECB President Draghi won’t be talking about the monetary policy at the Symposium; however, the doors are still open for EUR jawboning. The ECB minutes released earlier this month showed the policymakers aren’t comfortable with the sharp appreciation in the EUR. Thus, the odds are low that Draghi would say anything that would lift the EUR. If anything, the risks are skewed to the downside.
EUR/USD Technical Outlook
Monthly Chart
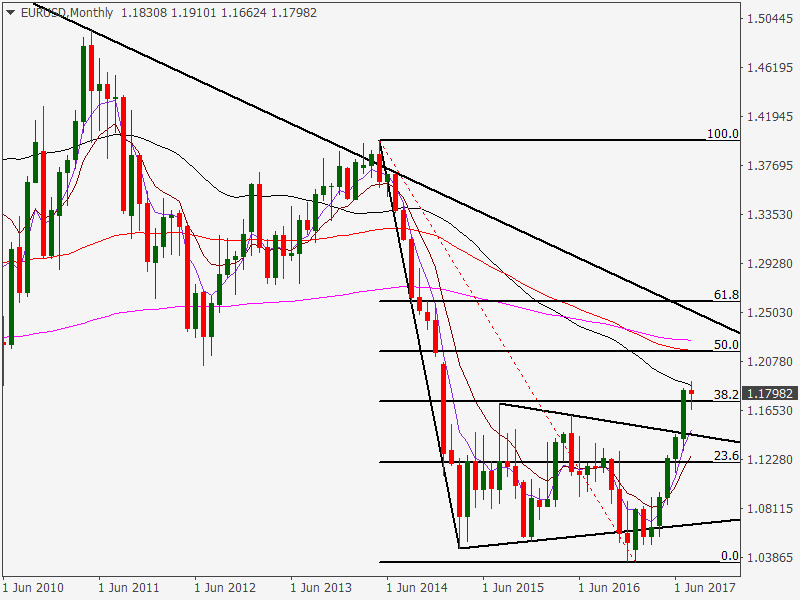
- The bullish move appears to have run out of steam the downward sloping 50-MA, while the downside is being capped around 1.1736 [38.2% Fib R of May 2014 high - Jan 2017 low] this month.
- The sideways channel was breached on the higher side last month. So the immediate downside appears capped around 1.1480 [flag support + monthly 5-MA].
- On the higher side, key resistance levels are 1.2042 [July 2012 low] and 1.2262 [monthly 200-MA] and 1.2528 [falling trend line drawn from July 2008 high and May 2011 high]. Note that the bearish reversal seen back in May 2014 was preceded by a failure to capitalize on the trend line break.
Daily chart

- A bullish descending triangle breakout on the chart above is hardly encouraging given it was a sideways breach and the trend line hurdle is still intact.
- Multiple candles with long tails earlier this month have established 1.1660-1.1730 as a strong support zone.
- A downside break would open doors for 1.1633 [upward sloping 50-MA] and 1.16 handle. On the higher side, breach of the trend line hurdle would expose 1.20 [key psychological hurdle + big resistance as per options markets].
Key levels to watch out for - 1.16 and 1.20
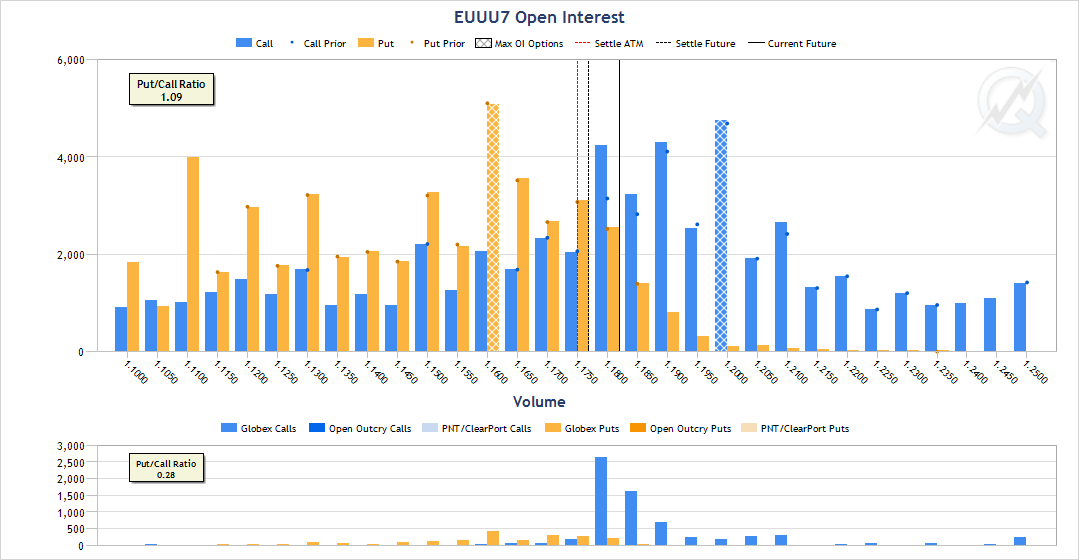
Chart Source: CME
The CME data for EUR/USD Sep expiry options shows 1.16 Put and 1.20 Call carry the highest cumulative OI. Thus, both levels are likely to act as make/break levels. This is because a dip below 1.16 would force Put writers to unwind their positions, leading to a big sell-off to 1.15-1.1480 region. On the higher side, a breach of 1.20 would force Call writers to unwind their shorts, thus opening doors for a big descending trend line hurdle seen at 1.2528.
View:
- Watch out for a break below 1.16 if Yellen comes out hawkish. Dip demand is likely around 1.15 handle. Dips below 50-DMA are likely to be short lived.
- On the other hand, dovish comments from Yellen could easily push EUR/USD above 1.20. Persistent dip demand below 1.20 following a break higher and a multiple end of the day close above the key psychological hurdle would open doors for 1.25 levels.
- A Neutral Yellen would allow short-term bullish technicals to take over, in which case a re-test of 1.1910 [recent highs] appears likely.
GBP/USD - Limited scope for rally
GBP/USD dropped to 1.2778; the lowest level since June 27. The pair has been steadily losing altitude following a rally to 1.3268 in late July. As discussed here, the sell-off is largely a result of BOE no longer facing the policy dilemma.
As of now, the spot is chipping away at the support offered by the trend line sloping upwards from April 10 low and June 21 low.
GBP/USD Technical Outlook
Daily chart
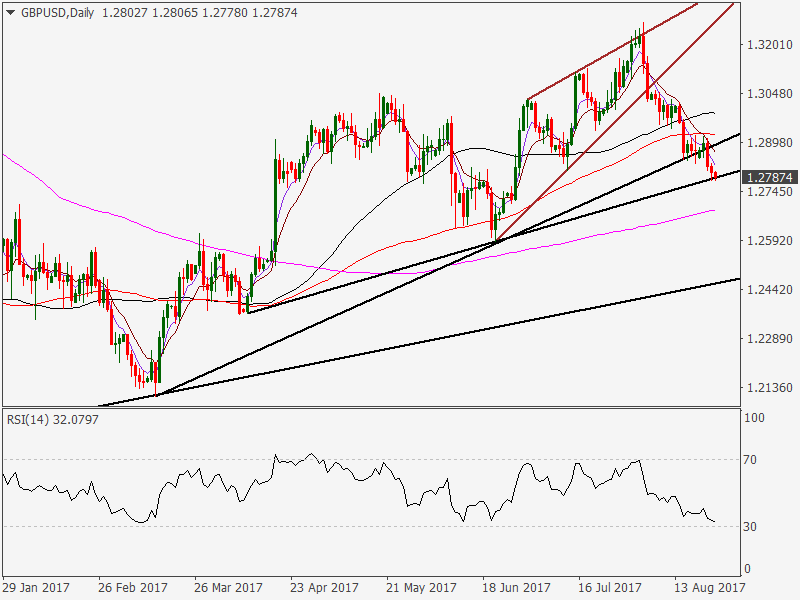
- A weekly close below 1.2788 would open doors for 1.2633 [weekly 50-MA].
- Such a move would push the 14-day RSI into the oversold territory, thus a technical correction could follow.
- On the higher side, any move above the downward sloping 10-DMA is likely to be short lived as the BOE is no longer under pressure to raise rates.
View:
- Dovish Yellen may boost GBP/USD, although gains are likely to be capped around 1.2920. Moreover, the Fed is still the most hawkish central bank out there and the BOE is not seen raising rates before 2019.
- Hawkish Yellen could yield a sell-off to the weekly 50-MA level of 1.2633.
- A dud Jackson Hole event would allow the bearish technicals to take over.
Author

Omkar Godbole
FXStreet Contributor
Omkar Godbole, editor and analyst, joined FXStreet after four years as a research analyst at several Indian brokerage companies.