It’s not just OpenAI, it’s anthropic
The Anthropic vs. OpenAI battle is historic and could end up being the Yahoo vs. Google of this generation. Or the Lycos vs. Ask Jeeves I suppose. Or maybe it’s a battle with two winners like XBOX vs. PlayStation, or Visa vs. Mastercard? Anyway, it’s hot and the WSJ recently ran some charts showing the gargantuan scale of the economic projects involved.
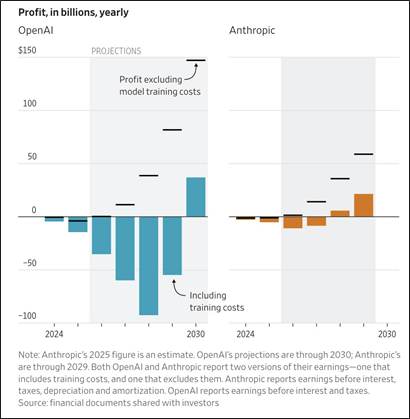
They are nice enough to include “profit excluding training costs.” LOL! Like that figure from GM: Profit excluding cost of manufacturing the cars. Here’s free cashflow.
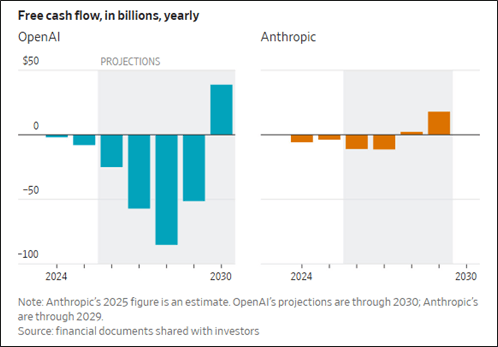
These numbers are from the financial documents the companies shared with investors.
You can trade the future IPO value of both OpenAI and Anthropic on IG Markets, and as you might guess, Anthropic has been outperforming. I am surprised there has not yet been a flippening; Anthropic still trades a bit below OpenAI.
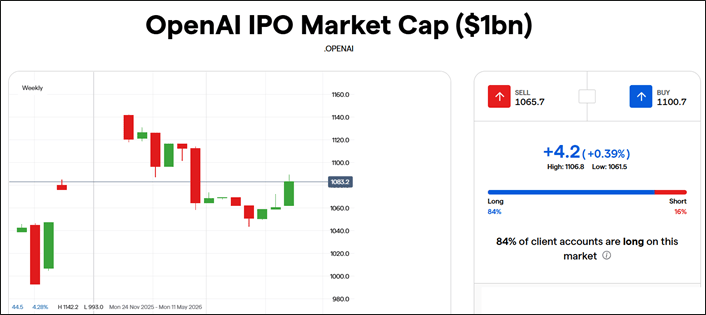
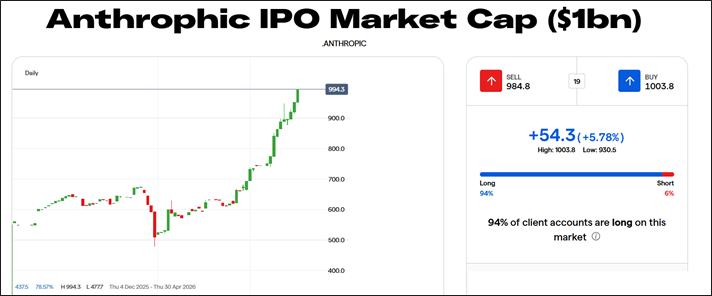
I present this mostly because I find it interesting, but it’s an important theme for anyone trading MSFT vs. AMZN because those companies are levered to OpenAI and Anthropic respectively. I would guess the most exposed stock to OpenAI's fate is Microsoft by a wide margin. They've got a huge profit-share stake in OpenAI and have utilized it in Azure, GitHub, Copilot, Office 365, Bing, and Windows. Meanwhile, Amazon has made Claude the anchor of AWS Bedrock, and owns around 10%-15% of the company (though they have also invested significantly in OpenAI). Other beneficiaries of Anthropic success would be ZM (they own 1%-2% of the company, worth $10B/$20B) and Google (they own 14%).
Stocks
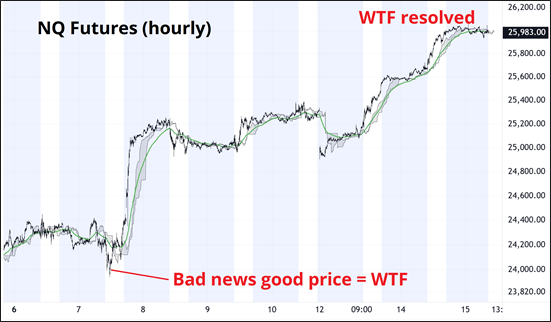
The fun part of the equity rally is probably done now as IGV, KORU, MSFT, and basically everything went to the moon and has now stabilized. I’m no longer bullish these things. Back to neutral. The WTF Indicator triggered Monday morning at 7 a.m. as every one of my 200 chats yelled: WHY ARE STONKS NOT LOWER!? This type of indicator is a short-term thing very similar to bad news/good price and so it has now run its course.
I find that setups like this (buy rumor/sell fact, good news/bad price, the Cheer Hedge, Sunday gap reversals, and more) quite consistently have a shelf life of 36-48 hours. There is no behavioral reason to expect further upside in stocks at this point, so I’m back to neutral. That does not mean I am bearish.
We are now through the period of furious ex-post rationalization where you can read about how “The Strait of Hormuz is closed, but it’s fine because reasons” or “The economy can handle $100 oil with wages up here” or “500bps of Fed rate hikes don’t matter for the economy, in fact they are bullish because the top of the K gets more interest income.” Oh, that last one is the hindsight explanation for why rate hikes didn’t matter. But much as the market got the rate hikes thing wrong, it looks like it might have got the Hormuz thing wrong as we are seven weeks into a crisis that was supposed to start around Week 5.
- Energy disruption is near-term, not permanent — Angelo Kourkafas, Edward Jones.
- This is not a new permanent regime of higher inflation, energy prices, and rates — Peter Tuz, Chase Investment Counsel Corp.
- Mission accomplished is being priced in — Jake Behan, Direxion.
- There is little evidence of meaningful demand destruction — Jake Behan, Direxion.
- Higher earnings estimates make the backdrop feel OK — Chris Fasciano, Commonwealth Financial Network
- Stocks already traded the oil shock and moved on after crude peaked — Nicholas Colas, DataTrek Research.
- Markets have effectively decided the war is over — Mike Dolan, Reuters.
- Not enough GDP drag for portfolios to go to ground — Mike Dolan, Reuters.
- Durable de-escalation should keep risk appetite firm and dips buyable — Michael Brown, Pepperstone.
I think it’s useful to have an open mind now, especially because of the mean reverting nature of the policy shock. Trump will likely be emboldened by higher stock prices and lower oil and therefore the market has relieved the pressure on him to capitulate to Iranian demands. Let’s see.
Tax day
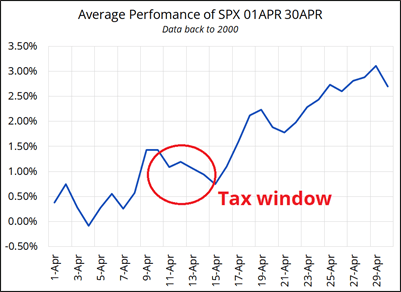
Today is Tax Day. I have written about this many times in the past. The TLDR is that tax payments are a meaningful liquidity event as money comes out of the system for a few days. This has a marginal USD higher and stocks lower impact. The thing is, because of the short covering this week, the normal pattern of weak equities into tax day has not held. The chart at right shows the average path of stocks in April. You can see the tax-related selling, but again, that’s not happening this year as the institutional short covering dwarfs the retail tax money selling.
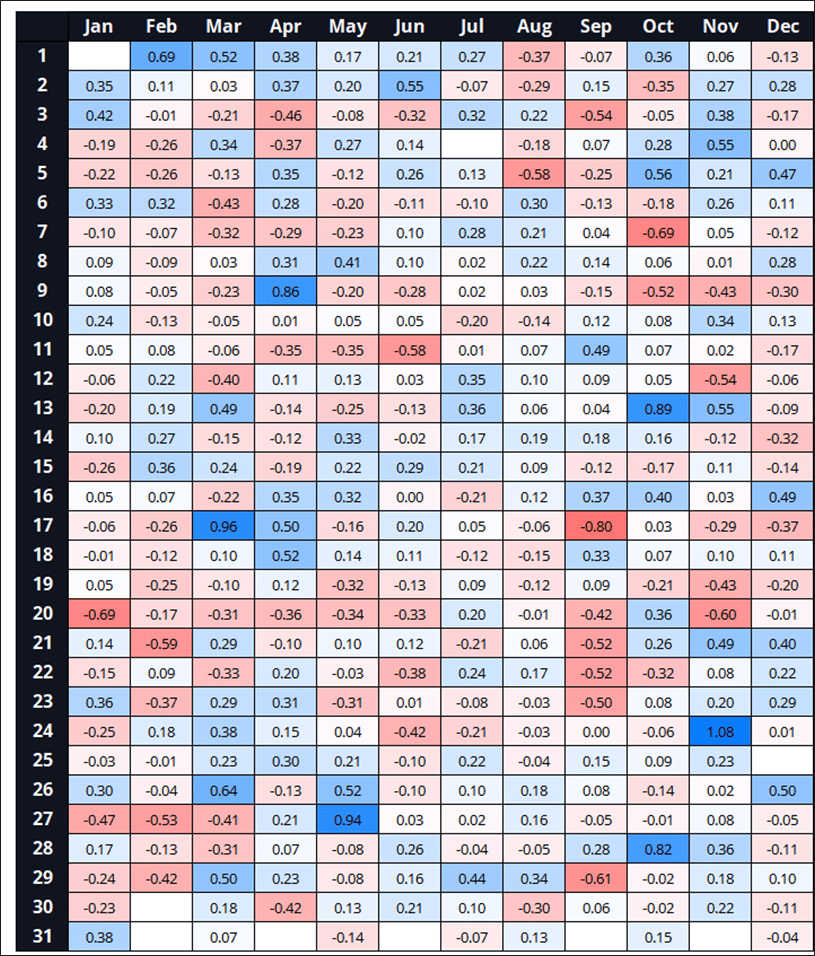
I checked what happens in years when stocks go up 13-15 April to see if there is still a bullish impulse afterwards. The results show that the bullish behavior 16-18 April is not conditional on 13-15 April changes. It makes no difference whether stocks went up or down into April 15—they still generally rally on the days that follow. For your viewing pleasure, I have attached the table of average SPX daily returns back to 2000. Note the blue after Tax Day.
To summarize all of the above: The short squeeze has run its course but there is no reason to be bearish in the short term. Markets might have it right and they might have it wrong on Hormuz, but for now the bulls are in control. We are back above the 200-day, tickling ATH, AI fever has returned, and short-term seasonality is bullish. But nobody is ready for another bad news smackdown.
Path of least resistance is higher stocks, lower vol, lower USD but risk smacking headline risk is real again.
Final thoughts
- A poll I conducted. Related to the opening of today’s am/FX. Not very optimistic!
- If Avis doesn’t do a secondary soon, their CFO should be fired.
- The all-time high in QQQ is 637 and that’s a MAJOR double top. Big level for your notepad.
- My son bought my wife a birdhouse for Christmas in 2021. We installed it on our fence, outside the kitchen window.
In 2022, a family of birds used it and we got to see the baby birds come out for the first time and learn to fly. They would wobble in the air and crash onto the ground and keep trying over and over. It was awesome and inspiring.
Then, no birds came in for the next few years.
This morning, two birds are in there, sizing it up! Woohoo! Nature is lit.
Author

Brent Donnelly
Spectra Markets
Brent Donnelly is the President of Spectra Markets. He has been trading currencies since 1995 and writing about macro since 2004. Brent is the author of “Alpha Trader” (2021) and “The Art of Currency Trading” (Wiley, 2019).


