It's all lies part 2a: Fiscal spending and the money supply myth

If you haven’t read part 1, which covered what QE is and what it is not, you can find it here. In part 2a I am going to dissect how fiscal spending works and the money supply myth. While fiscal spending has gained a lot of attention the past year or so, it is nothing new. Fiscal spending has been occurring long before the Fed started QE for the first time back in December 2008. The US government has always received its money via taxes, revenue, and the issuance of debt. These are the channels through which the government has always been able to pay its liabilities such as social security, medicare, unemployment, military, etc. This is how fiscal spending has always worked and continues to work. It is simply a redistribution– money from one part of the economy is being redistributed to another part of the economy via taxes and government debt. When you pay taxes, you transfer your money to the government who can then use that money to pay someone’s unemployment benefits, for example, or be used to finance the building of a bridge. The same thing happens when you purchase a government bond, you buy a bond from the US Treasury, who gets your cash and then the US government can redistribute it to a different part of the economy, depending on where it is needed. This is how fiscal spending worked prior to QE and has continued to work even after the implementation of QE.
This redistribution of US dollars is not just true for the domestic economy, but for the entire globe as well. When a foreign entity (investor, corporation, central bank, etc.) uses their excess dollars (that they have via global trade), they often recycle them back into the US by purchasing US Treasuries. So, let’s say a foreign bank uses excess dollars that it has to purchase US Treasuries at auction; the US Treasury then receives those dollars in exchange for Treasuries (debt) and the US government can then use those dollars to fund their liabilities. Again, a redistribution, because dollars came from one part of the economy and were redistributed to a different part of the economy– except it took place on a global level instead of just a domestic one. This has essentially been the agreement the US has had with the rest of the world since the USD became the Global Reserve Currency (GRC) at the Bretton Woods Conference in 1944. The US will supply the world with dollars, and in exchange the world will recycle those dollars back into the US (so that the US can continue to deficit spend, a function of the GRC) by purchasing US assets, particularly Treasuries. However, since the end of WWII, the US economy has become a smaller and smaller slice of the of the overall global GDP pie, making it more and more difficult for the US to fund the world with the dollars that it needs, hence the global dollar shortage I briefly mentioned in part 1. This is what led to the abandonment of the gold standard in 1971 and why the eurodollar market grew so rapidly from the 1960s on, after coming into existence sometime in the mid-1950s. It came about to fill the global void that was dollars. We will dive a little deeper into the eurodollar market later.
The idea of money printing to fund government liabilities was never really used until the GFC (at least in more recent times). Since March 2020, everywhere you turn there are talks about the Fed printing money out of thin air and the government using this printed money to fund liabilities. We know from part 1 that the Fed isn’t actually printing money. Yet, this is still the mainstream consensus. However, recently more and more people have figured out that QE is not money printing, which has led to a new argument to try to support the notion that the Fed is printing money to fund government liabilities. Some have argued (and many now believe) that fiscal spending on its own is NOT money printing and QE on its own is also NOT money printing. But, when you combine fiscal with QE, you get money printing! Wait, what? So, NOT money printing (fiscal) + NOT money printing (QE) = money printing? I know, it sounds ridiculous, but this is the argument. The main reason they say it is now money printing is because the broad money supply has increased along with the Fed’s balance sheet. If you look (below), I have a chart of the Fed’s balance sheet alongside the M2 money supply metric. Many believe this is all that’s needed to prove that the Fed is printing money. But, as we know from part 1, that is not the case.
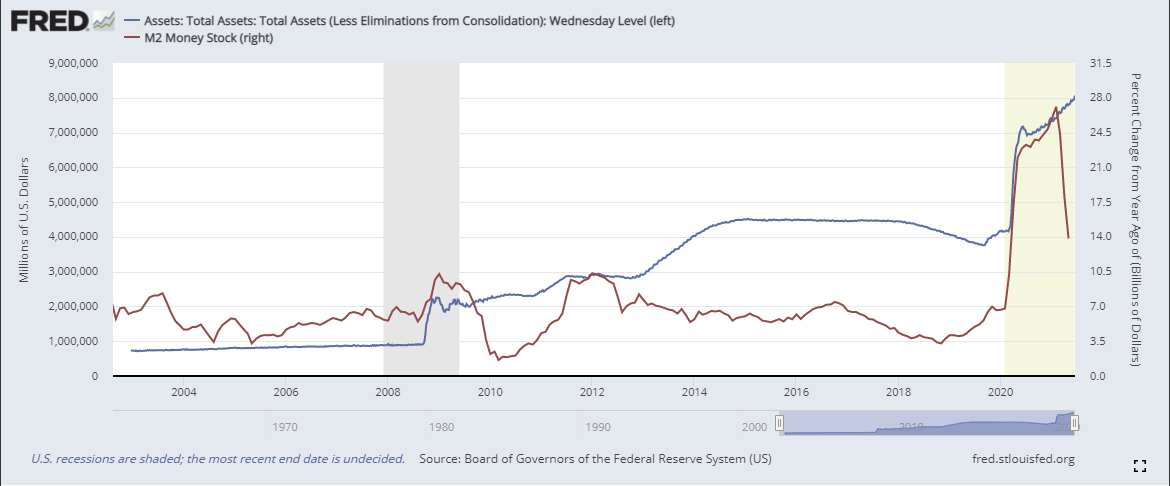
First, what is the M2 money supply? What is the broad money supply? I am just going to keep it simple and give you the definition straight from the Federal Reserve’s website, “The money supply measures reflect the different degrees of liquidity—or spendability—that different types of money have. The narrowest measure, M1, is restricted to the most liquid forms of money; it consists of currency in the hands of the public; travelers checks; demand deposits, and other deposits against which checks can be written. M2 includes M1, plus savings accounts, time deposits of under $100,000, and balances in retail money market mutual funds.” The Fed also used to publish an M3 metric which included M1, M2, plus eurodollars and repo, but they no longer do. This M3 was the “broad” money supply as it attempted to capture the broadest measure of money. We will come back to M3 and why this metric is no longer used in part 2b. But, as you can see from looking at M1 and M2 (I am going to refer to them often as the M’s), it only tracks a very small number of avenues where money could possibly sit. Even just looking at the M2, time deposits (such as a CD) are only included in the money supply if they are under $100,000. That means time deposits over $100,000 are NOT included in the money supply – this is just one example of money that exists that is NOT captured in any of the money supply metrics. As we go deeper into this, you will realize that this barely scratches the surface. There are likely more dollars that exist outside of the money supply metrics than are actually captured by them, as you will see.
Think about a buiness line of credit, or a home equity line of credit. If you have a home equity line of credit, this is a loan from the bank which is NOT included in the M’s. But, Ryan, as we know from part 1, banks loan money into existence, so if this is used to purchase a bond, isn’t it the same as if the Fed were to print money? No, for two reasons: first, that money was already accounted for by the system, because when the loan was created it goes on the bank’s balance sheet and your balance sheet as the borrower. Second, let’s say you draw on this line of credit and purchase a US Treasury. That money then goes to the Treasury, and the US government can then use that money to send someone a stimulus check. That stimulus check gets deposited into someone’s checking account, causing the M2 to rise. This is still a redistribution. When you make a purchase with your equity line, your spendability declines by the amount of the purchase (until paid back) and the person or persons who received a stimulus check get an increase in their spendability – the net effect is zero. Now, the M2 did increase, but was new money printed? Or has it simply found its way from an account NOT captured by the M2 to an account captured by the M2? Do you see what I am getting at? Money is constantly exiting and entering accounts which are captured by the money supply metrics. When money enters, the M’s rise. When money exits, the M’s fall. At any given time none of the M’s actually capture all of the dollars in existence. This can and does happen at every single Treasury auction. The trillions of dollars that were used to finance the fiscal stimulus packages in the past year or so have been from non-M’s sources and credit lines. In part 2b, there will be more examples of money that exists outside of the M’s that can be and are used in the purchasing of US Treasuries.
Do you see how misleading the M2 (along with all the rest of the M’s) can be? In this scenario the M2 rose, making it look like money was printed when clearly it was not. This type of scenario occurs all the time. Once you understand that QE is not money printing, and Fiscal is a redistribution, it does not matter if Fiscal and QE are done at the same time, it still does not equate to money printing. It may be easier to make it look like money printing (which is the intention of the Fed), but knowing how easily the M’s are manipulated and that they only track a portion of the dollars in existence (as you will see), you then know to look beyond the M’s because of their inaccuracy and illegitimacy in determining what’s really happening under the surface– what is really happening with money.
I would love to show you some data that proves the exact number of dollars that have exited and entered the M’s. The exact number of non-M’s dollars that have been used to purchase Treasuries and fund government liabilities. I would love nothing more. But, unfortunately it is not so easy and simple (I tried). In fact, it is nearly impossible because there are so many avenues where money is created and destroyed, that are barely captured by any metric, or not even captured at all (which we will see in part 2b). However, what is easy and simple is throwing up a chart of the Fed’s balance sheet, the M2, maybe even bank deposits which all show large increases over the past year or so, and using them as evidence that money was created. Just go back in this article to the chart of M2 and the Fed’s balance sheet. People think this is all there is to it. Fed’s balance sheet rose, M2 rose, boom! money printing! But, as you saw in part 1, it is not so easy and simple. How the system actually works is far more complicated and intricate than the Fed and mainstream economics will lead us to believe. Even if you think I’m not on the right track with all of this, at the very least, you should be asking questions, you should have realized by now that there is more to the story. There is more to all of this than the Fed prints money out of thin air, M2 rose as proof of this money printing, the money is injected into the economy, the economy gets a nice boost, and everyone lives happily ever after. What I am trying to do is take you away from your home in Kansas and pull back the curtain on the Great and Powerful Fed and the mainstream narratives that support them. In part 2b we will dive deeper into this. We will get into where most of the non-M’s money is – repo and eurodollars.
Author

Ryan Miller
Ryan Miller Trading Economics
Ryan Miller received a Bachelors Degree in History from William Paterson University. Through his studies of U.S. history, he developed an interest in the implications the financial markets have on the economy.















