Executive Summary

At first glance, it appears that the financial health of the European financial system is better today than it was a decade ago. Not only is the banking system better capitalized, but the amount of debt owed by banks has receded in recent years. Moreover, some of the debt that appears to reside in the financial sector via the balance sheets of "captive" financial institutions may truly belong in the non-financial corporate sector.

But a closer look leaves some cause for concern. Specifically, government bonds comprise a meaningful proportion of banking system assets in some countries, and there are governments in some euro area countries that have elevated levels of debt. An extended sell-off of government debt, if not an outright default by one or more of those governments, would deal a devastating blow to those banking systems. The banking system may not have as much debt as it did a few years ago, but the overall financial system in the Eurozone is not free of debt concerns.


Financial System Continues to Grow, Although Debt Has Leveled Off

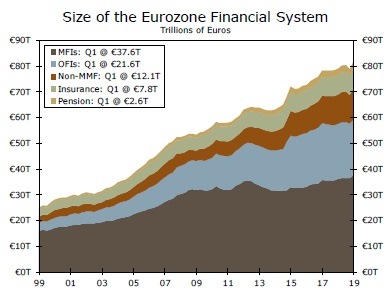
In this, the fifth installment in our series on debt in the Eurozone, we examine the financial sector. As shown in Figure 1, the overall financial system held €25 trillion worth of assets when European Monetary Union (EMU) commenced in 1999. Monetary financial institutions (MFI)—largely banks and the central bank—accounted for roughly two-thirds of the system's assets at that time. The remaining one-third of the sector's assets was held by non-money market mutual funds, insurance companies, pension funds and other financial institutions (OFIs), which is a catch-all for a variety of institutional types that we will subsequently discuss in more detail.1 Over the past twenty years, the size of the financial sector has grown to more than €80 trillion. Although each of the sub-sectors has increased in absolute size, the OFI sub-sector has grown more than six-fold since 1999. The share of the financial sector's assets that is held by MFIs has declined to 46% while the OFI share has risen to 26%, up from only 13% twenty years ago.

fxsoriginal

Turning our attention to the liability side of the balance sheet, the MFI and OFI sub-sectors account for the vast majority of the financial sector's debt, with most of the growth in recent years occurring among OFIs (Figure 2). Because MFIs and OFIs together account for roughly 75% of the financial sector's assets and 95% of its debt, we will limit our analysis to these two sub-sectors in the remainder of this report.

INDU


MFI's: Potential Vulnerability to Holdings of Government Debt

The MFI sub-sector includes deposit-taking institutions (largely commercial banks), the central bank and money market mutual funds. Although the balance sheet of the European Central Bank (ECB) has mushroomed from €1.5 trillion in September 2008 to nearly €4.7 trillion at present, the ECB currently accounts for only 12% of the assets of the MFI sub-sector. Likewise, the ECB has no debt obligations on its balance sheet. Depository institutions, which we will hereafter refer to as "banks," hold the vast majority of the sub-sector's assets, as well as all of its debt.

Figures 1 & 2 make it clear that the MFI sub-sector in the Eurozone enjoyed strong growth in the years leading up to the Great Recession. After trending lower between 2012 and 2014, the assets of the MFI sub-sector have risen nearly 20% over the past five years. Although the ECB has expanded its balance sheet in recent years, banking system assets have also grown, especially in the last year. But the debt obligations of the banking system have declined roughly €1 trillion over that period. In short, the banking system has become a bit more dependent on deposits to finance the loans that it makes. Specifically, the loan-to-deposit ratio of the banking system exceeded 90% as recently as 2011, but that ratio stands at 87% today. Because deposits are widely viewed as a more stable form of finance than debt, the banking system in the Eurozone is a bit less vulnerable today than it was a few years ago, at least in this regard.

Moreover, the overall banking system in the Eurozone is better capitalized today than it was in the years leading up to the global financial crisis. The capital buffers of the banking system were equivalent to less than 6% of assets in 2007 (Figure 3). But banks in the euro area have steadily built up capital in recent years, and those buffers today stand at roughly 8% of assets. In short, banks would be able to write down more troubled assets today than they could have a decade ago. But are their pockets deep enough to withstand an episode of extreme stress?

AUDJPY

As we noted in Part IV of this series, there are some countries in the euro area, notably Greece and Italy, in which government debt-to-GDP ratios are excessive. We do not have detailed data on the asset holdings of Greek banks, but data from the Bank for International Settlements show that government debt accounts for nearly 20% of banking sector assets in Italy (Figure 4). Furthermore, the vast majority of this exposure among Italian banks is to the Italian government. Italian banks, which in totality have €4.7 trillion worth of assets, have significant holdings of Italian government bonds. A significant sell-off in the Italian government debt market, let alone an outright default by the Italian government, should one occur, would bring the Italian banking system to its knees. A collapse of the Italian banking system would have deleterious implications for the €1.7 trillion ($2 trillion) Italian economy, which is the eighth largest economy in the world.

EURJPY

Furthermore, Spanish banks have significant exposure to Spanish government debt. Not only is the government debt-to-GDP ratio in Spain elevated—it is roughly 100% at present—but Spain is among the top 15 largest economies in the world. In sum, banks in the Eurozone generally do not appear to be as vulnerable today as they were a decade ago. However, their vast holdings of government debt securities leave some cause for concern because the financial health of some of those governments is not very robust at present.


Could OFIs Be the Achilles Heel of the Financial System?

As shown in Figures 1 & 2, the size of the OFI sub-sector has grown meaningfully over the past twenty years. While the assets of the MFI sector have more than doubled since 1999, the OFI sector has grown six-fold over that period, although the latter is currently about one-half the size of the former. But the OFI sub-sector has more than twice as much debt as the MFI sub-sector at present. Due to the rapid growth of the OFI sub-sector and the increasingly important role that it appears to be playing, a closer look at this vague sounding sub-sector is warranted.

Unfortunately, the OFI sub-sector is rather opaque. For starters, the OFI sub-sector is comprised of many different types of institutions including those that securitize assets, financial leasing companies, securities and derivatives dealers, venture capital firms, head offices of financial groups and holding companies, and "captive" financial institutions.2 Furthermore, there is not yet a harmonized reporting system across all 19 individual economies that comprise the euro area, so a precise breakdown of these institutions on a Eurozone-wide basis is not readily available. That said, we can glean some general insights into the OFI sub-sector from the fragmentary data that do exist.

First, about 70% of OFI assets are held in Luxembourg (€9.5 trillion) and the Netherlands (€5.2 trillion) with much smaller amounts residing in Ireland, Italy, France and Germany (Figure 5). According to the Banque Centrale du Luxembourg (BCL), the country's favorable tax and regulatory environment encourage OFIs to domicile in Luxembourg.3 Although current data are not available, the findings of a report that was published a few years ago are instructive. At the end of 2014, the assets of the OFI sub-sector in Luxembourg totaled nearly €8 trillion (Figure 6). The majority of these assets (€6 trillion) were held by "captive" financial institutions, which the BCL defines as "holding and issuing companies whose main objective is to facilitate intra-group transactions or to attract external funding for their parent company." Moreover, most of these assets were held by institutions that were affiliated with non-financial corporations (e.g., corporations in the oil, food, telecom and pharmaceutical industries). Research by economists at the Dutch central bank shows that the structure OFI sector in the Netherlands is very similar to its counterpart in Luxembourg.4 That is, most of the assets of the Dutch OFI sector are held by institutions that are affiliated with non-financial corporations

KBA

In short, a sizeable proportion of the OFI sub-sector in the euro area does not appear to be involved in the credit intermediation process. Rather, these companies act as conduits for transferring intracompany funds and/or they issue debt securities or borrow from banks on behalf of their parent companies, many of which are non-financial corporations. Consequently, the debt of the financial sector may not be as large as implied by Figure 2 if some of this debt is really the obligations of nonfinancial corporations. Unfortunately, determining exactly where the debt belongs is not straightforward because the readily available financial accounts data are generally not consolidated across sectors. That is, debt on the balance sheets of "captive" financial institutions may show up as debt of the financial sector rather than the debt of their parent companies, which are nonfinancial corporations.

Nevertheless, it is our sense that the financial sector in the Eurozone is not as levered today as it was a decade or so ago. As noted previously, the debt of the banking sector has receded in recent years. In addition, financial vehicle corporations (FVCs), which securitize assets on banks' balance sheets, are not as large today as they were a few years ago. Data from the European Systemic Risk Board show that the assets of FVCs in the euro area totaled €1.9 trillion at the end of 2017, down from about €2.4 trillion at the end of 2010.5 The decline in the size of the FVC sector in the Eurozone parallels the withering of asset-backed securities (ABS) issuers that we discussed in a report on financial sector debt in the United States. Furthermore, even if we took the total size of the MFI and OFI sectors at face value, it is still showing signs of deleveraging; the debt-to-GDP ratio of this aggregate is down nearly 19 percentage points from its peak in Q1-2015.


Conclusion

The financial sector in the Eurozone has enjoyed solid growth in recent years. While the sector's assets have grown 50% over the past ten years, the value of the financial sector's debt obligations are up only 20% over that period. At first glance, these metrics seem to imply that the financial health of the sector has improved. Indeed, the modest decline in banking sector debt in recent years and the rise in the system's capital buffers are consistent with some improvement in the financial health of the banking system.

That said, there are some issues that raise concern. First, the increase in OFI debt in recent years may mask some build-up in debt in the non-financial corporate sector. Insolvency issues in the non-financial corporate sector would ultimately lead to problems in the financial sector. In addition, government bonds comprise a meaningful proportion of banking system assets in some countries. As we noted in Part IV of this series, there are governments in some euro area countries that have elevated levels of debt. An extended sell-off of government debt if not an outright default by one or more of those governments, although not our base-case view, would deal a devastating blow to those banking systems. The banking system may not have as much debt as it did a few years ago, but the overall financial system in the Eurozone it is not free of debt concerns.


Downlaod The Full Special Reports

Recently, the stock market has experienced high levels of volatility. If you are thinking about participating in fast moving markets, please take the time to read the information below. Wells Fargo Investments, LLC will not be restricting trading on fast moving securities, but you should understand that there can be significant additional risks to trading in a fast market. We've tried to outline the issues so you can better understand the potential risks. If you're unsure about the risks of a fast market and how they may affect a particular trade you've considering, you may want to place your trade through a phone agent at 1-800-TRADERS. The agent can explain the difference between market and limit orders and answer any questions you may have about trading in volatile markets. Higher Margin Maintenance Requirements on Volatile Issues The wide swings in intra-day trading have also necessitated higher margin maintenance requirements for certain stocks, specifically Internet, e-commerce and high-tech issues. Due to their high volatility, some of these stocks will have an initial and a maintenance requirement of up to 70%. Stocks are added to this list daily based on market conditions. Please call 1-800-TRADERS to check whether a particular stock has a higher margin maintenance requirement. Please note: this higher margin requirement applies to both new purchases and current holdings. A change in the margin requirement for a current holding may result in a margin maintenance call on your account. Fast Markets A fast market is characterized by heavy trading and highly volatile prices. These markets are often the result of an imbalance of trade orders, for example: all "buys" and no "sells." Many kinds of events can trigger a fast market, for example a highly anticipated Initial Public Offering (IPO), an important company news announcement or an analyst recommendation. Remember, fast market conditions can affect your trades regardless of whether they are placed with an agent, over the internet or on a touch tone telephone system. In Fast Markets service response and account access times may vary due to market conditions, systems performance, and other factors. Potential Risks in a Fast Market "Real-time" Price Quotes May Not be Accurate Prices and trades move so quickly in a fast market that there can be significant price differences between the quotes you receive one moment and the next. Even "real-time quotes" can be far behind what is currently happening in the market. The size of a quote, meaning the number of shares available at a particular price, may change just as quickly. A real-time quote for a fast moving stock may be more indicative of what has already occurred in the market rather than the price you will receive. Your Execution Price and Orders Ahead In a fast market, orders are submitted to market makers and specialists at such a rapid pace, that a backlog builds up which can create significant delays. Market makers may execute orders manually or reduce size guarantees during periods of volatility. When you place a market order, your order is executed on a first-come first-serve basis. This means if there are orders ahead of yours, those orders will be executed first. The execution of orders ahead of yours can significantly affect your execution price. Your submitted market order cannot be changed or cancelled once the stock begins trading. Initial Public Offerings may be Volatile IPOs for some internet, e-commerce and high tech issues may be particularly volatile as they begin to trade in the secondary market. Customers should be aware that market orders for these new public companies are executed at the current market price, not the initial offering price. Market orders are executed fully and promptly, without regard to price and in a fast market this may result in an execution significantly different from the current price quoted for that security. Using a limit order can limit your risk of receiving an unexpected execution price. Large Orders in Fast Markets Large orders are often filled in smaller blocks. An order for 10,000 shares will sometimes be executed in two blocks of 5,000 shares each. In a fast market, when you place an order for 10,000 shares and the real-time market quote indicates there are 15,000 shares at 5, you would expect your order to execute at 5. In a fast market, with a backlog of orders, a real-time quote may not reflect the state of the market at the time your order is received by the market maker or specialist. Once the order is received, it is executed at the best prices available, depending on how many shares are offered at each price. Volatile markets may cause the market maker to reduce the size of guarantees. This could result in your large order being filled in unexpected smaller blocks and at significantly different prices. For example: an order for 10,000 shares could be filled as 2,500 shares at 5 and 7,500 shares at 10, even though you received a real-time quote indicating that 15,000 shares were available at 5. In this example, the market moved significantly from the time the "real-time" market quote was received and when the order was submitted. Online Trading and Duplicate Orders Because fast markets can cause significant delays in the execution of a trade, you may be tempted to cancel and resubmit your order. Please consider these delays before canceling or changing your market order, and then resubmitting it. There is a chance that your order may have already been executed, but due to delays at the exchange, not yet reported. When you cancel or change and then resubmit a market order in a fast market, you run the risk of having duplicate orders executed. Limit Orders Can Limit Risk A limit order establishes a "buy price" at the maximum you're willing to pay, or a "sell price" at the lowest you are willing to receive. Placing limit orders instead of market orders can reduce your risk of receiving an unexpected execution price. A limit order does not guarantee your order will be executed -" however, it does guarantee you will not pay a higher price than you expected. Telephone and Online Access During Volatile Markets During times of high market volatility, customers may experience delays with the Wells Fargo Online Brokerage web site or longer wait times when calling 1-800-TRADERS. It is possible that losses may be suffered due to difficulty in accessing accounts due to high internet traffic or extended wait times to speak to a telephone agent. Freeriding is Prohibited Freeriding is when you buy a security low and sell it high, during the same trading day, but use the proceeds of its sale to pay for the original purchase of the security. There is no prohibition against day trading, however you must avoid freeriding. To avoid freeriding, the funds for the original purchase of the security must come from a source other than the sale of the security. Freeriding violates Regulation T of the Federal Reserve Board concerning the extension of credit by the broker-dealer (Wells Fargo Investments, LLC) to its customers. The penalty requires that the customer's account be frozen for 90 days. Stop and Stop Limit Orders A stop is an order that becomes a market order once the security has traded through the stop price chosen. You are guaranteed to get an execution. For example, you place an order to buy at a stop of $50 which is above the current price of $45. If the price of the stock moves to or above the $50 stop price, the order becomes a market order and will execute at the current market price. Your trade will be executed above, below or at the $50 stop price. In a fast market, the execution price could be drastically different than the stop price. A "sell stop" is very similar. You own a stock with a current market price of $70 a share. You place a sell stop at $67. If the stock drops to $67 or less, the trade becomes a market order and your trade will be executed above, below or at the $67 stop price. In a fast market, the execution price could be drastically different than the stop price. A stop limit has two major differences from a stop order. With a stop limit, you are not guaranteed to get an execution. If you do get an execution on your trade, you are guaranteed to get your limit price or better. For example, you place an order to sell stock you own at a stop limit of $67. If the stock drops to $67 or less, the trade becomes a limit order and your trade will only be executed at $67 or better. Glossary All or None (AON) A stipulation of a buy or sell order which instructs the broker to either fill the whole order or don't fill it at all; but in the latter case, don't cancel it, as the broker would if the order were filled or killed. Day Order A buy or sell order that automatically expires if it is not executed during that trading session. Fill or Kill An order placed that must immediately be filled in its entirety or, if this is not possible, totally canceled. Good Til Canceled (GTC) An order to buy or sell which remains in effect until it is either executed or canceled (WellsTrade® accounts have set a limit of 60 days, after which we will automatically cancel the order). Immediate or Cancel An order condition that requires all or part of an order to be executed immediately. The part of the order that cannot be executed immediately is canceled. Limit Order An order to buy or sell a stated quantity of a security at a specified price or at a better price (higher for sales or lower for purchases). Maintenance Call A call from a broker demanding the deposit of cash or marginable securities to satisfy Regulation T requirements and/or the House Maintenance Requirement. This may happen when the customer's margin account balance falls below the minimum requirements due to market fluctuations or other activity. Margin Requirement Minimum amount that a client must deposit in the form of cash or eligible securities in a margin account as spelled out in Regulation T of the Federal Reserve Board. Reg. T requires a minimum of $2,000 or 50% of the purchase price of eligible securities bought on margin or 50% of the proceeds of short sales. Market Makers NASD member firms that buy and sell NASDAQ securities, at prices they display in NASDAQ, for their own account. There are currently over 500 firms that act as NASDAQ Market Makers. One of the major differences between the NASDAQ Stock Market and other major markets in the U.S. is NASDAQ's structure of competing Market Makers. Each Market Maker competes for customer order flow by displaying buy and sell quotations for a guaranteed number of shares. Once an order is received, the Market Maker will immediately purchase for or sell from its own inventory, or seek the other side of the trade until it is executed, often in a matter of seconds. Market Order An order to buy or sell a stated amount of a security at the best price available at the time the order is received in the trading marketplace. Specialists Specialist firms are those securities firms which hold seats on national securities exchanges and are charged with maintaining orderly markets in the securities in which they have exclusive franchises. They buy securities from investors who want to sell and sell when investors want to buy. Stop An order that becomes a market order once the security has traded through the designated stop price. Buy stops are entered above the current ask price. If the price moves to or above the stop price, the order becomes a market order and will be executed at the current market price. This price may be higher or lower than the stop price. Sell stops are entered below the current market price. If the price moves to or below the stop price, the order becomes a market order and will be executed at the current market price. Stop Limit An order that becomes a limit order once the security trades at the designated stop price. A stop limit order instructs a broker to buy or sell at a specific price or better, but only after a given stop price has been reached or passed. It is a combination of a stop order and a limit order. These articles are for information and education purposes only. You will need to evaluate the merits and risks associated with relying on any information provided. Although this article may provide information relating to approaches to investing or types of securities and investments you might buy or sell, Wells Fargo and its affiliates are not providing investment recommendations, advice, or endorsements. Data have been obtained from what are considered to be reliable sources; however, their accuracy, completeness, or reliability cannot be guaranteed. Wells Fargo makes no warranties and bears no liability for your use of this information. The information made available to you is not intended, and should not be construed as legal, tax, or investment advice, or a legal opinion.

Recommended Content


Recommended Content

Editors’ Picks

AUD/USD risks a deeper drop in the short term

AUD/USD risks a deeper drop in the short term

AUD/USD rapidly left behind Wednesday’s decent advance and resumed its downward trend on the back of the intense buying pressure in the greenback, while mixed results from the domestic labour market report failed to lend support to AUD.

AUD/USD News

EUR/USD leaves the door open to a decline to 1.0600

EUR/USD leaves the door open to a decline to 1.0600

A decent comeback in the Greenback lured sellers back into the market, motivating EUR/USD to give away the earlier advance to weekly tops around 1.0690 and shift its attention to a potential revisit of the 1.0600 neighbourhood instead.

EUR/USD News

Gold is closely monitoring geopolitics

Gold is closely monitoring geopolitics

Gold trades in positive territory above $2,380 on Thursday. Although the benchmark 10-year US Treasury bond yield holds steady following upbeat US data, XAU/USD continues to stretch higher on growing fears over a deepening conflict in the Middle East.

Gold News

Bitcoin price shows strength as IMF attests to spread and intensity of BTC transactions ahead of halving

Bitcoin price shows strength as IMF attests to spread and intensity of BTC transactions ahead of halving

Bitcoin (BTC) price is borderline strong and weak with the brunt of the weakness being felt by altcoins. Regarding strength, it continues to close above the $60,000 threshold for seven weeks in a row.

Read more

Is the Biden administration trying to destroy the Dollar?

Is the Biden administration trying to destroy the Dollar?

Confidence in Western financial markets has already been shaken enough by the 20% devaluation of the dollar over the last few years. But now the European Commission wants to hand Ukraine $300 billion seized from Russia.

Read more

Majors

Cryptocurrencies

Signatures