Is the stock market's steady 2017 uptrend finally running out of brea(d)th?

Yesterday's big drop in global stock markets certainly caused investors to sit up a little straighter. All told, the S&P 500 fell by 1.54% on the day, the second-largest drop of the year and the biggest drop in three months. This drop was accompanied by a spike in the VIX (Wall Street's "Fear Gauge") to 15, near the highest level seen since the US election.
On a historical basis, yesterday's drop isn't particularly significant. As Eddy Elfenbein at Crossing Wall Street noted, "Last year, the S&P 500 had 48 days in which it closed up or down by more than 1%. In 2015, there were 72. So far this year, there have been seven." In other words, yesterday's fall only feels so large because we've been locked in one of the lowest volatility environments ever for the past few months. Remarkably, the S&P 500 has yet to see a 3% peak-to-trough drawdown since election day, over nine months ago.
That may be due to change.
Make no mistake: Q2 earnings season was generally strong, with FactSet reporting that 73% of companies beating earnings estimates (well above the 5-year average of 68%) and 69% of companies beating revenue estimates (also well above the 5-year average of 53%) as of Monday. Despite this fundamental tailwind though, we've seen some significant technical headwinds emerge over the last couple of weeks.
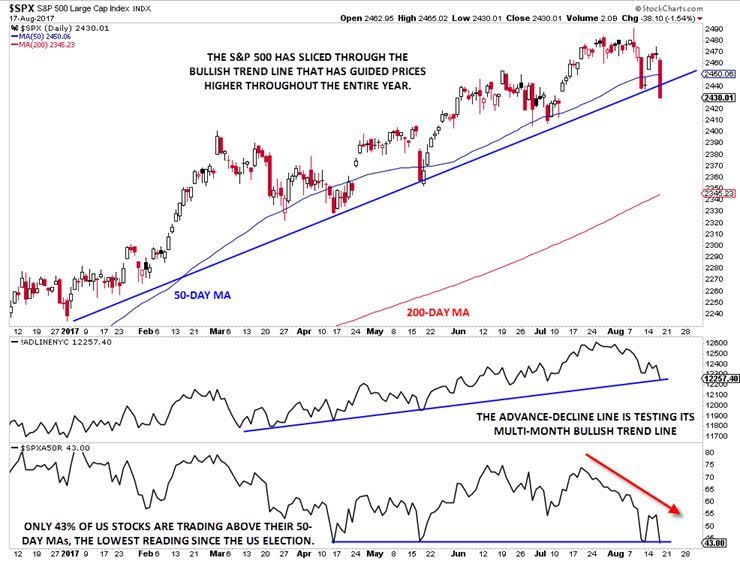
Most obviously, the S&P 500 has sliced through the clear bullish trend line that has been guiding prices higher throughout the entire year to date. Taken in isolation, this signal is reason enough for short-term bulls to tap the brakes, but it's even more concerning taking the recent deterioration in market breadth into account.
For the uninitiated, market breadth simply seeks to quantify the number of stocks showing bullish and bearish characteristics. In general, breadth can provide a leading indicator for the indices. If an index is rising but showing deteriorating breadth, it suggests that the rally is being driven by just a few -- likely large cap or highly priced -- stocks, which generally means it is more vulnerable to a downturn. Conversely, a falling market with improving breadth is often a precursor to a significant bottom, as it shows that the "market of stocks" is improving.
In a way, you can think of market breadth like a runner's "breath". The runner showing labored breathing, even if she's not yet slowing down, is more likely to drop off than one who has a healthy breathing pattern.
The below chart shows two of our favorite breadth indicators for the S&P 500: the common stock only advance-decline line and the % of S&P 500 stocks above the 50-day moving average. Both of these key breadth measures are testing critical support levels. The advance-decline line is testing its six-month bullish trend line, and if it breaksdown in the coming week, it would confirm the breakdown in the S&P 500 index. Meanwhile, the % of S&P 500 stocks trading above their 50-day moving averages has fallen to just 43%, the lowest point this year. Put another way, the majority of the stocks in the S&P 500 are in downtrends (as measured by price relative to the 50-day MA), despite the index itself trading within a few percentage points of its all-time high.
Of course, we could well see the US stock market come roaring back to set fresh all-time highs in the coming week; we've certainly come back from worse before! But when we start to see indicators that we haven't seen all year (the VIX spiking to a 9-month high, the S&P 500 breaking a key trend line, breadth deteriorating significantly, etc), it's definitely a sign for bulls to take a step back and reevaluate the landscape.
Author

Matt Weller, CFA, CMT
Faraday Research
Matthew is a former Senior Market Analyst at Forex.com whose research is regularly quoted in The Wall Street Journal, Bloomberg and Reuters. Based in the US, Matthew provides live trading recommendations during US market hours, c


