Is gold’s latest recovery over?

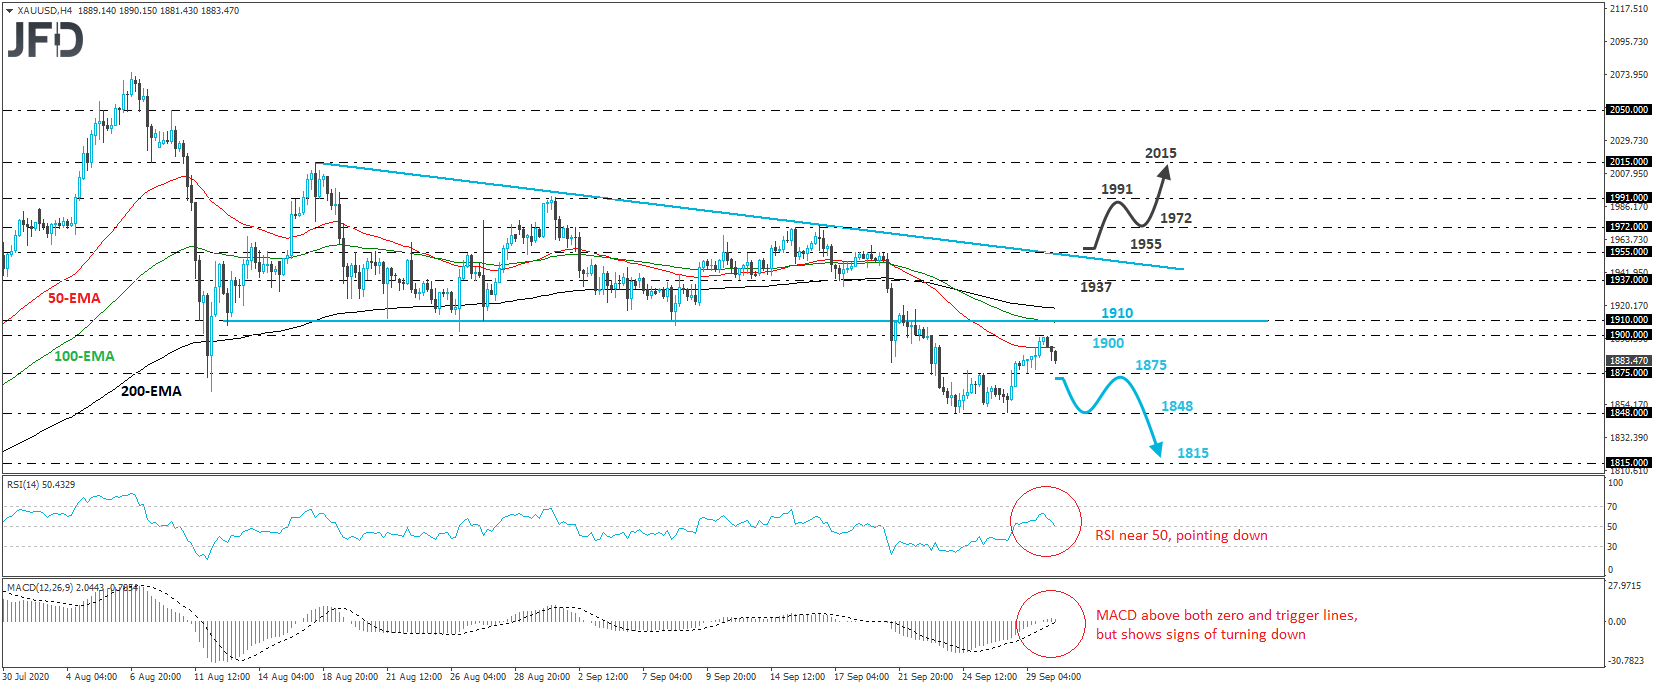
XAU/USD traded lower on Wednesday, after it hit resistance at the 1900 zone. Overall the metal continues to trade below the 1910 barrier, which acted as the lower bound of the triangle that contained the price action from August 12th until September 21st, and thus, we see decent chances for the bears to take fully charge again soon.
A clear and decisive dip back below 1875, which is near the highs of last Thursday and Friday, may confirm that Monday’s and Tuesday’s recovery was just a corrective rebound and may encourage the bears to target Monday’s low, at around 1848. A break lower would confirm a forthcoming lower low and may set the stage for more declines, perhaps towards the 1815 zone, which provided strong resistance between July 8th and 17th.
Shifting attention to our short-term oscillators, we see that the RSI turned down and now looks ready to fall below its 50 line, while the MACD, although above both its zero and trigger lines, shows signs it could turn south as well. Both indicators suggest that the yellow metal may start picking up negative momentum, which supports the notion for another negative leg in the short run.
We will start considering the bullish case only if we see a strong recovery above 1955. Such a move would also take gold above the upper end of the pre-mentioned triangle and may initially target the highs of August 15th and 16th, at around 1972. Another break, above 1972, may pave the way towards the peak of September 1st, near 1991. If the bulls are not willing to stop there either, then we may see them pushing the battle up to the 2015 area, marked as a resistance by the high of August 18th.
JFDBANK.com - One-stop Multi-asset Experience for Trading and Investment Services
Author

JFD Team
JFD


