Is Crude Oil at a crossroads?
The gap. The test. The pattern. What does this combination say about the behavior of market participants?
Over the last few weeks, I have been sharing with you my point of view on the current technical situation in the XOI, natural gas, copper, and individual companies every trading day. Thanks to them, many of you have made the decision to act in accordance with the forecasts and have already made money. Congratulations to you!
But probably at the same time, many of you may have been wondering: hey, what about crude oil? Why don't we know what your point of view on this most important (or one of the most important) commodity for us is? Today, I decided to pull back the curtain and share with you my premium part on crude oil from yesterday. Why? Because yesterday we closed our short positions and took quite nice profits off the table. If you want to know what technical factors influenced this decision, I encourage you to read the article below.
And… if next time you don't want to miss such an opportunity and join the group of investors who also make money on this commodity, I encourage you to subscribe to Oil Trading Alerts. Yup, the next profitable opportunities may be just around the corner.
Technical picture of Crude Oil
Briefly: in my opinion, closing our profitable short positions and taking profits off the table is justified from the risk/reward point of view.
In yesterday’s Oil Trading Alert, you could read the following:
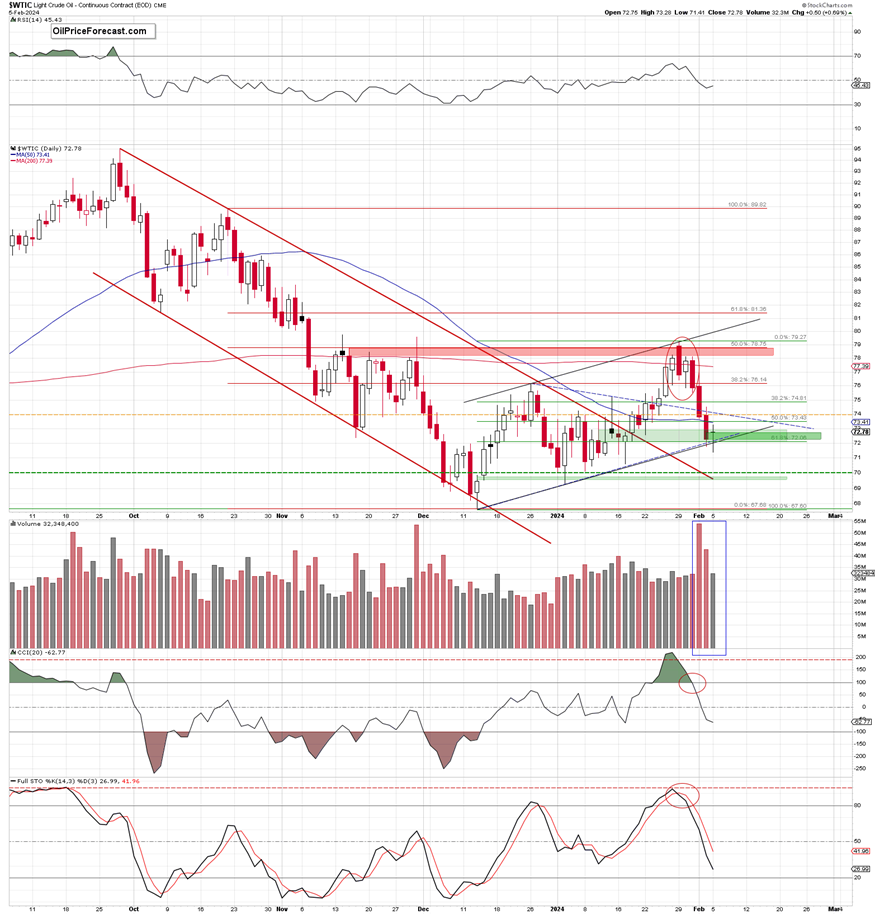
(…) the green gap from Jan.12 remained open, which, in combination with the nearest supports, suggests that the bulls may be a bit more active in this area – especially when we factor in the 61.8% Fibonacci retracement (based on the entire mid-Dec.-Jan. upward move) and smaller volume during the session.
From today’s point of view, we see that the situation developed in tune with the above assumption and yesterday’s session left a doji candle on the chart, which signals that market participants are indecisive.
In other words, the bears are not as strong as they were earlier.
But let's start from the beginning…
Looking at the daily chart, we see that yesterday’s session started with a green gap ($72.28-$72.75), which encouraged the bears to attack and deprive the bulls of a new ally.
Thanks to their action, the price of black gold dived below all important very short-term supports (the lower border of the black channel, the lower line of the blue triangle, the lower border of the green gap from Jan.12, and the 61.8% Fibonacci retracement), but the sellers were unable to keep the commodity at such low levels.
Their opponents came back to the trading floor and pushed light crude higher, invalidating all breakdowns under the mentioned levels. This positive development encouraged them to go north even further, but the proximity to the previously broken 50-day moving average was enough to trigger a pullback.
Finally, crude oil closed the day only 3 cents above the opening price, creating on the chart a dragonfly doji candlestick formation, which can signal a potential reversal.
Such a scenario is currently also supported by yesterday’s price action: pro-bullish green gap, the mentioned invalidation of the breakdowns under support, and visibly lower volume. At this point, it is worth keeping in mind that the smaller volume (from session to session) signals the bears' decreasing involvement in the generated declines, which raises some concerns about their willingness to fight for lower levels.
Taking profits off the table
Connecting the dots, it seems that closing our profitable short positions (as a reminder, they were open a week ago when crude oil was trading above $77) and taking profits off the table is justified from the risk/reward point of view at the moment.
Nevertheless, please keep in mind that even if the buyers push the commodity higher, the way north may not be as easy as it may seem. Why? Because light crude is still trading not only below the previously broken upper border of the blue triangle and the upper line of the orange consolidation (marked with an orange dashed line on the above chart), but also under the 50-day moving average.
Additionally, the sell signals generated by the indicators remain in the cards (as well as the strong pro-declining candlestick formation [a big bearish engulfing candlestick pattern, which materialized on significant volume] I wrote about yesterday), therefore, in my opinion, opening long positions is not justified from the risk/reward perspective.
Nevertheless, if the bulls show weakness in the coming days and reliable technical signals appear, I’ll consider re-opening short positions. Stay tuned.
Summing up, oil bulls managed to invalidate earlier breakdowns under important supports, which, in combination with the green gap from the beginning of the day and a doji candlestick formation, suggests that reversal and rebound may be just around the corner. Therefore, closing our profitable short positions (as a reminder, they were open a week ago when crude oil was trading above $77) and taking profits off the table is justified from the risk/reward point of view.
Want free follow-ups to the above article and details not available to 99%+ investors? Sign up to our free newsletter today!
Want free follow-ups to the above article and details not available to 99%+ investors? Sign up to our free newsletter today!
Author

Anna Radomska
Sunshine Profits
Anna's passion for drawing evolved into a fascination with colorful lines and shapes, which later inspired her interest in the stock market.


