Is a Santa Claus rally on its way? [Video]
![Is a Santa Claus rally on its way? [Video]](https://editorial.fxstreet.com/images/Markets/Currencies/Majors/DollarIndex/close-up-look-of-markets-various-bills-1775965_XtraLarge.jpg)
US Dollar: Dec '21 USD is Down at 96.240.
Energies: Jan '22 Crude is Up at 72.36.
Financials: The Mar '22 30 Year bond is Up 12 ticks and trading at 162.09.
Indices: The Dec '21 S&P 500 emini ES contract is 44 ticks Higher and trading at 4696.00.
Gold: The Feb'22 Gold contract is trading Up at 1790.60. Gold is 59 ticks Higher than its close.
Initial conclusion
This is not a correlated market. The dollar is Down, and Crude is Up which is normal, but the 30-year Bond is trading Higher. The Financials should always correlate with the US dollar such that if the dollar is lower then the bonds should follow and vice-versa. The S&P is Higher, and Crude is trading Higher which is not correlated. Gold is trading Higher which is correlated with the US dollar trading Up. I tend to believe that Gold has an inverse relationship with the US Dollar as when the US Dollar is down, Gold tends to rise in value and vice-versa. Think of it as a seesaw, when one is up the other should be down. I point this out to you to make you aware that when we don't have a correlated market, it means something is wrong. As traders you need to be aware of this and proceed with your eyes wide open. Currently, all of Asia is trading Higher. Europe is trading Mixed with about half the exchanges trading Higher and the other half Lower.
Possible challenges to traders today
-
JOLTS Job Openings is out at 10 AM EST. This is Major.
-
Crude Oil Inventories are out at 10:30 AM EST. This is Major.
-
10-y Bond Auction is out at 1 PM EST. This is Major.
Treasuries
Traders, please note that we've changed the Bond instrument from the 30 year (ZB) to the 10 year (ZN). They work exactly the same.
We've elected to switch gears a bit and show correlation between the 10-year bond (ZN) and the S&P futures contract. The S&P contract is the Standard and Poor's, and the purpose is to show reverse correlation between the two instruments. Remember it's likened to a seesaw, when up goes up the other should go down and vice versa.
Yesterday the ZN made its move at around 7:35 AM EST. The ZN hit a High at around that time and the S&P moved Higher. If you look at the charts below ZN gave a signal at around 7:35 AM EST and the S&P moved Higher at around the same time. Look at the charts below and you'll see a pattern for both assets. ZN hit a High at around 7:35 AM EST and the S&P was moving Higher shortly thereafter. These charts represent the newest version of MultiCharts and I've changed the timeframe to a 15-minute chart to display better. This represented a Shorting opportunity on the 10-year note, as a trader you could have netted about a 20 ticks per contract on this trade. Each tick is worth $15.625. Please note: the front month for the ZN is now Mar '22. The S&P contract is now Mar '22 as well. I've changed the format to Renko bars such that it may be more apparent and visible.
Charts Courtesy of MultiCharts built on an AMP platform Click on an image to enlarge it.
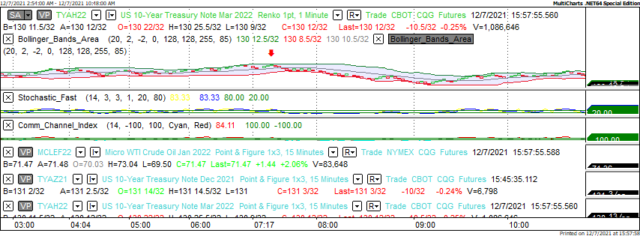
ZN - Mar 2022 - 12/07/21
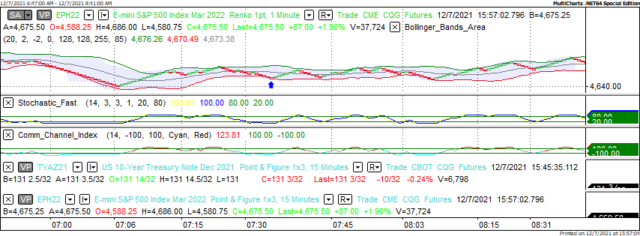
S&P - Mar 2022 - 12/07/21
Bias
Yesterday we gave the markets a Neutral or Mixed as the indices were trading Mixed Tuesday morning. The markets leapt Higher as the Dow jumped 492 points and the other indices gained ground as well. Today we aren't dealing with a correlated market and our bias is Neutral or Mixed.
Could this change? Of Course. Remember anything can happen in a volatile market.
Commentary
So once again the markets decide to go Higher despite any indication to the contrary. It begs us to ask the question this time of the year: Is a Santa Claus on its way? In recent years' this has not been the case. Recently at around the holiday season the markets remained steady and in positive territory. However, this time around we're seeing a leap into positive territory despite any indication otherwise. Case in point today Biden and Putin "met" via a Zoom call, but nothing was resolved. At any other time of the year this might have created a market meltdown but that was not the case today. Will this continue?? As in all things, only time will tell....
Author

Nick Mastrandrea
Market Tea Leaves


