|

$INTL INTL Fcstone Inc Daily Elliott Wave Analysis

This is a daily Elliott Wave analysis of the aforementioned company. Firstly I will mention some of the company’s past history and merger. INTL Fcstone Inc is a Fortune 500 financial services industry firm listed on the Nasdaq exchange. The company has offices worldwide and is headquartered in New York City, NY in the United States of America. This company was founded in 1978 and was known as the Farmers Commodities Corporation until 2002. The company went public with a stock offering in 2007. FCStone Group Inc. and the International Assets Holding Corporation merged in 2009 to form the current INTL FCStone Inc. There is a stock price history back until 1995 and shows a nice uptrend. In 2016 according to Bloomberg rankings it was the #1 market maker in 2016 for international securities traded over-the-counter. Also it was ranked #1 by dollar value for approximately 2,500 securities.

Secondly as for the Elliott Wave analysis shown below the focus is in the nearer term from the February 11th, 2016 lows at 24.27. The larger degree cycle highs and lows of the stock are consistent with the US indices high and low cycle troughs and peaks. I would figure as long as this company’s balance sheets remain favorable it would continue to progress higher.

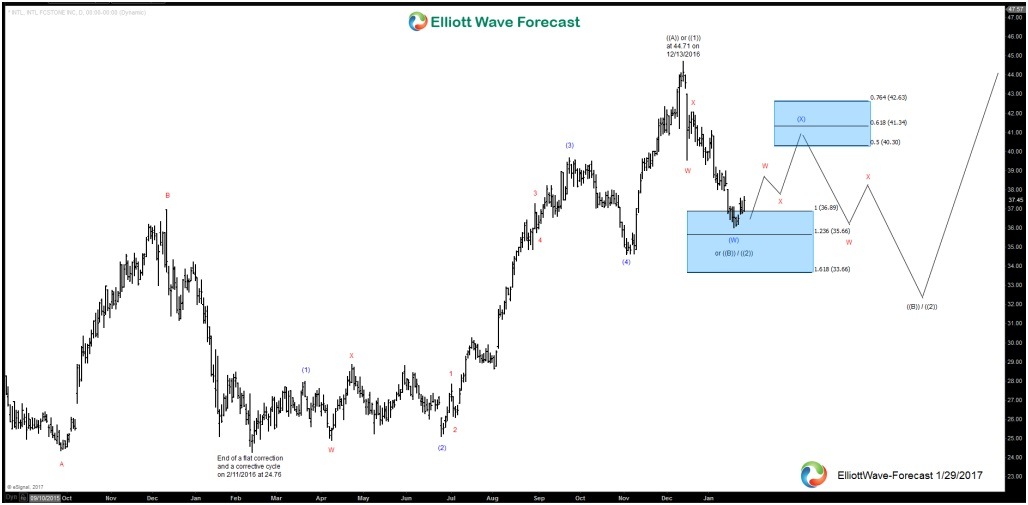
To conclude , from the 2/11/2016 lows, the stock is showing an uptrend still and appears ended an impulse cycle up on the 13th of December at 44.71. From there the stock has declined in three swings to 36.02 on 1/20/2017. There is a chance this is all of a correction of the cycle up from 2/11/2016 lows. However until or unless it shows it will break above to new highs again by the time it reaches the 40.30-41.34 Fibonacci retracement area, it should see one more swing lower to correct the cycle up from 2/11/2016 before continuing the uptrend.

INTL Daily Chart

Elliot

Author

Elliott Wave Forecast Team

Elliott Wave Forecast Team

ElliottWave-Forecast.com

More from Elliott Wave Forecast Team
Share:

Editor's Picks

EUR/USD flirts with daily highs, retargets 1.1900

EUR/USD regains upside traction, returning to the 1.1880 zone and refocusing its attention to the key 1.1900 barrier. The pair’s slight gains comes against the backdrop of a humble decline in the US Dollar as investors continue to assess the latest US CPI readings and the potential Fed’s rate path.

GBP/USD remains well bid around 1.3650

GBP/USD maintains its upside momentum in place, hovering around daily highs near 1.3650 and setting aside part of the recent three-day drop. Cable’s improved sentiment comes on the back of the Greenback’s  irresolute price action, while recent hawkish comments from the BoE’s Pill also collaborate with the uptick.

Gold clings to gains just above $5,000/oz

Gold is reclaiming part of the ground lost on Wednesday’s marked decline, as bargain-hunters keep piling up and lifting prices past the key $5,000 per troy ounce. The precious metal’s move higher is also underpinned by the slight pullback in the US Dollar and declining US Treasury yields across the curve.

Crypto Today: Bitcoin, Ethereum, XRP in choppy price action, weighed down by falling institutional interest 

Bitcoin's upside remains largely constrained amid weak technicals and declining institutional interest. Ethereum trades sideways above $1,900 support with the upside capped below $2,000 amid ETF outflows.

Week ahead – Data blitz, Fed Minutes and RBNZ decision in the spotlight

US GDP and PCE inflation are main highlights, plus the Fed minutes. UK and Japan have busy calendars too with focus on CPI. Flash PMIs for February will also be doing the rounds. RBNZ meets, is unlikely to follow RBA’s hawkish path.

Ripple Price Forecast: XRP potential bottom could be in sight

Ripple edges up above the intraday low of $1.35 at the time of writing on Friday amid mixed price actions across the crypto market. The remittance token failed to hold support at $1.40 the previous day, reflecting risk-off sentiment amid a decline in retail and institutional sentiment.